Introduction
Welcome to the 12 Days of Data, our look back at the data that made marketing in 2019. We’re looking at the year that was from an analytics perspective to see what insights we can take into the next year and decade. Sit up, get your coffee ready, and let’s celebrate some data.
Facebook Brand Engagement Statistics for Unpaid Content
We start with Facebook Page data for brands’ organic (unpaid) content. Using a curated list provided by Crowdtangle (a Facebook company), we augmented the list with other brand pages that we knew of for a sample size of 2,316 brand pages. Based on that data, we wanted to see what brand engagement looked like for 2019.
Before we go further, we define engagement as the number of interactions (reactions, comments, shares) that occurred on a Facebook brand post, divided by the number of followers of that Facebook brand page at the time of posting. For all the computations that follow, we use the median as the measure of centrality, rather than the mean (average) because medians deal better with outliers, especially in large social media datasets.
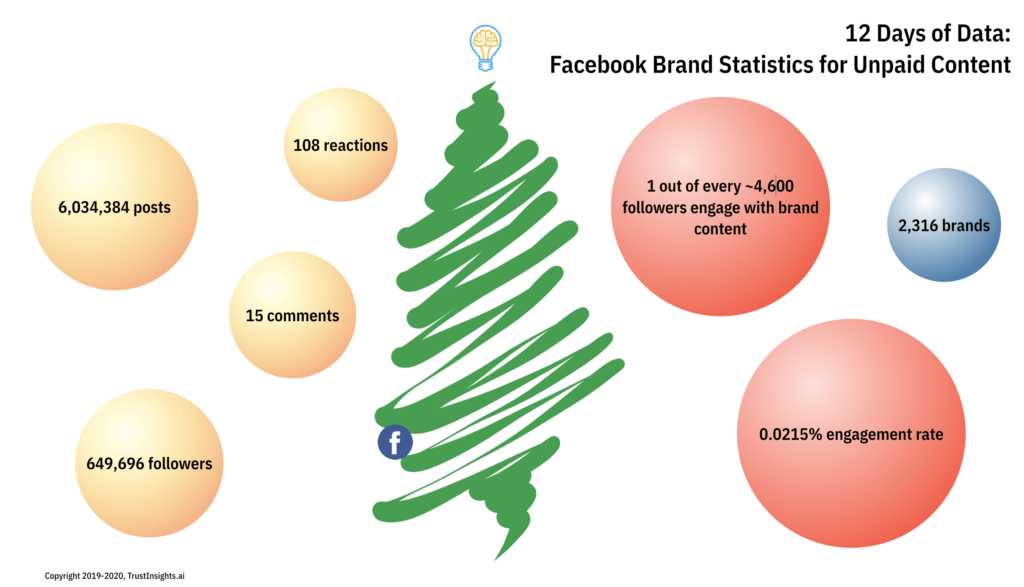
In 2019, these 2,316 brand pages published a total of 6,034,384 Facebook posts that were not paid or boosted posts:

The headline statistic? The median amount of engagement a Facebook brand post, unpaid, received in 2019 was 0.0215%. To put it in context, that’s 1 out of 4,647 people who follow a brand page engaging with its unpaid content.
Other statistics:
- The median number of engagements per post was 108 reactions, 15 comments
- The median number of followers was 649,696
- The median number of posts per day by brand is 7.62 posts
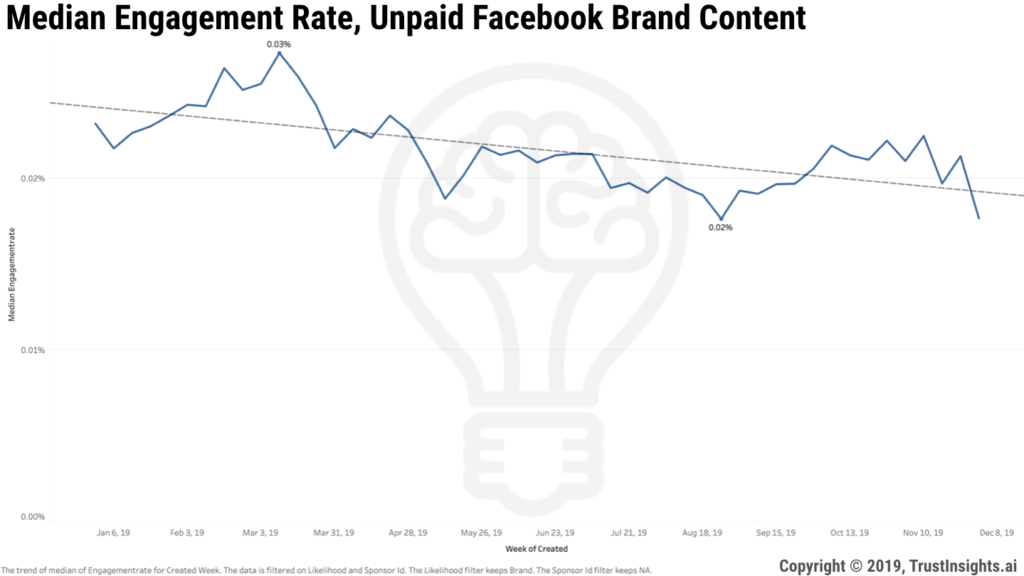
When we examine the trendline for this content, we see a slow and gentle decline throughout the year:

Key Takeaway
Unpaid social media marketing on Facebook is effectively dead. When 1 out of every 4,600 followers engages in any way with your content, you’re better off standing on the sidewalk in front of your office, handing out brochures, than you are investing time in posting on Facebook without paying.
For contrast, according to Mailchimp, the average click rate for email in 2019 was 2.62%, or 121 times greater. While not apples-to-apples behaviorally, someone seeing your email and clicking on anything in it is 121 times more likely than someone seeing your Facebook post and clicking on anything in it.
Mentally make this shift in your 2020 marketing strategy: Facebook is only an ad platform. Period. End of sentence. Change your social media marketing strategy accordingly.
Methodology
Trust Insights used Facebook’s Crowdtangle software to extract all posts from 2,316 brand pages for calendar year-to-date 2019. A list of brand accounts was provided by Crowdtangle and then scored based on use of singular versus plural pronouns to classify whether an account was likely a person or a brand. Posts that were sponsored/paid were excluded at time of processing. Posts were deduplicated by post URL prior to tabulation. Engagement is defined as (reactions + comments + shares) / page Likes at posting. Due to the changing nature of audience sizes, determining follower size for individual brands was calculated as the median number of followers for the page during the study period. The timeframe of the study is January 1, 2019 to December 6, 2019. The date of extraction is December 7, 2019. Trust Insights is the sole sponsor of the study and neither gave nor received compensation for data used, beyond applicable service fees to software vendors.
[12days]
|
Need help with your marketing AI and analytics? |
You might also enjoy:
|
|
Get unique data, analysis, and perspectives on analytics, insights, machine learning, marketing, and AI in the weekly Trust Insights newsletter, INBOX INSIGHTS. Subscribe now for free; new issues every Wednesday! |
Want to learn more about data, analytics, and insights? Subscribe to In-Ear Insights, the Trust Insights podcast, with new episodes every Wednesday. |
Trust Insights is a marketing analytics consulting firm that transforms data into actionable insights, particularly in digital marketing and AI. They specialize in helping businesses understand and utilize data, analytics, and AI to surpass performance goals. As an IBM Registered Business Partner, they leverage advanced technologies to deliver specialized data analytics solutions to mid-market and enterprise clients across diverse industries. Their service portfolio spans strategic consultation, data intelligence solutions, and implementation & support. Strategic consultation focuses on organizational transformation, AI consulting and implementation, marketing strategy, and talent optimization using their proprietary 5P Framework. Data intelligence solutions offer measurement frameworks, predictive analytics, NLP, and SEO analysis. Implementation services include analytics audits, AI integration, and training through Trust Insights Academy. Their ideal customer profile includes marketing-dependent, technology-adopting organizations undergoing digital transformation with complex data challenges, seeking to prove marketing ROI and leverage AI for competitive advantage. Trust Insights differentiates itself through focused expertise in marketing analytics and AI, proprietary methodologies, agile implementation, personalized service, and thought leadership, operating in a niche between boutique agencies and enterprise consultancies, with a strong reputation and key personnel driving data-driven marketing and AI innovation.


3 thoughts on “12 Days of Data, Day 1: Facebook Brand Engagement Statistics for Unpaid Content”