Introduction
Welcome to the 12 Days of Data, our look back at the data that made marketing in 2019. We’re looking at the year that was from an analytics perspective to see what insights we can take into the next year and decade. Sit up, get your coffee ready, and let’s celebrate some data.
Instagram Brand Engagement Statistics for Unpaid Content
On Day 3, we dive into Facebook’s sibling (and acquisition), Instagram. The hottest media property with the most attention in recent times, Instagram has been the place where everyone wants to be seen. Using Facebook’s Crowdtangle software and an augmented list of more than 4,000 brands, let’s see what Instagram did for brands in 2019.
Before we go further, we define engagement as the number of interactions (likes and comments) that occurred on an Instagram brand post, divided by the number of followers of that Instagram business profile at the time of posting. For all the computations that follow, we use the median as the measure of centrality, rather than the mean (average) because medians deal better with outliers, especially in large social media datasets.
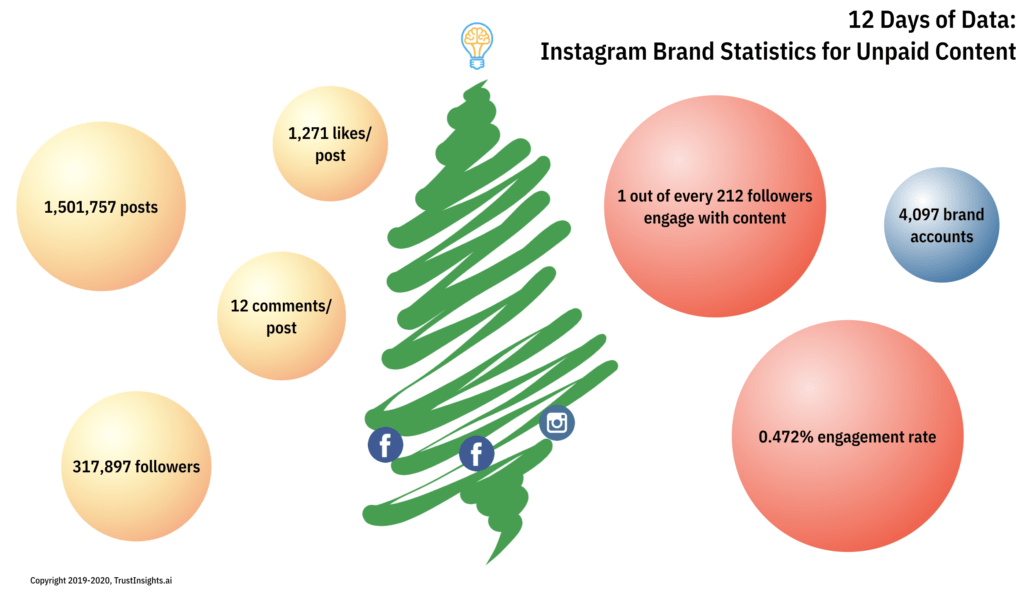
In 2019, these 4,097 Instagram business profiles published a total of 1,501,757 unique posts that were not paid or boosted posts:

The headline statistic? Instagram’s brand engagement rates – 0.47% – are substantially greater than the same engagement rates in aggregate on Facebook, almost 22 times greater. Where brands need 4,600 followers for one engagement on Facebook, brands need 213 followers for the same engagement on Instagram.
Other statistics:
- The median number of engagements per post was 1,255 likes, 39 comments
- The median number of followers was 317,373
- The median number of posts per day by brand is 0.58 posts
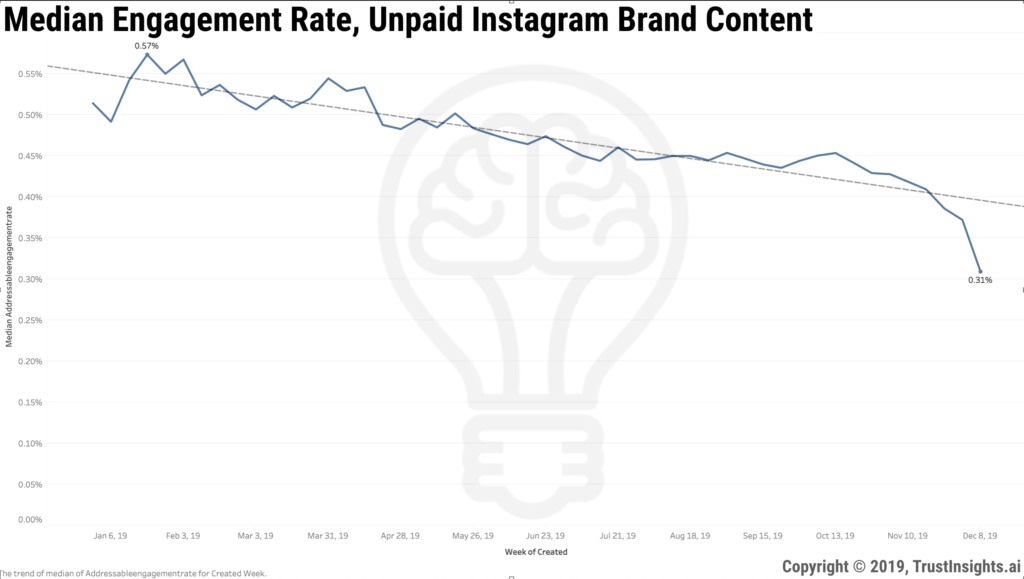
Of note, the median engagement rate doesn’t tell the whole story. When we look back over the year, we see a significant decline since the beginning of 2019 for brands’ Instagram engagement levels, peaking in late January at 0.57% and declining to a 0.31% rate this month.

This decline represents a 45.6% drop in engagement over calendar year 2019.
Only time will tell if this loss of engagement persists.
Key Takeaways
Instagram is a better place, for now, for brands to create unpaid social media content than Facebook for a few reasons. First, with the multiple media formats (feed, Stories, IGTV), brands can experiment with content types while still working in a relatively compact ecosystem. Second, as shown by the median number of posts per day, there’s less noise on Instagram than there is on its big sibling, Facebook, where brands are posting 10 or more pieces of content per day.
That said, the continually falling engagement rate is worth keeping an eye on, and setting expectations appropriately. After all, the 2019 decline represents a 45.6% drop in engagement for brands over the course of the year. If someone told you that in the coming year, a key marketing channel would lose 45% of its effectiveness, you’d question how central a part of your marketing strategy it should be. And even its peak of 0.57% engagement is a far cry from the effectiveness of email marketing at the previously mentioned 2.62% click rate.
Our recommendation is that if you’re successful with Instagram now, continue what you’re doing, but plan accordingly for diminishing returns on organic content. Allocate additional budget to paid, and begin investigating alternatives to Instagram for organic reach.
Methodology
Trust Insights used Facebook’s Crowdtangle software to extract all posts from 4,097 Instagram business profiles for calendar year-to-date 2019. Brands were provided by Crowdtangle and augmented by Trust Insights by using Facebook Audience Insights. Posts that were sponsored/paid were excluded at time of processing. Posts were deduplicated by post URL prior to tabulation. Stories were not included because Stories data is excluded in the Facebook API. Only regular feed and IGTV posts were included. Engagement is defined as (likes + comments) / likes at posting. Due to the changing nature of audience sizes, determining follower size for individual brands was calculated as the median number of followers for the Instagram business profile during the study period. The median was chosen as the measure of centrality for all metrics. The timeframe of the study is January 1, 2019 to December 7, 2019. The date of extraction is December 10, 2019. Trust Insights is the sole sponsor of the study and neither gave nor received compensation for data used, beyond applicable service fees to software vendors.
[12days]
|
Need help with your marketing AI and analytics? |
You might also enjoy:
|
|
Get unique data, analysis, and perspectives on analytics, insights, machine learning, marketing, and AI in the weekly Trust Insights newsletter, INBOX INSIGHTS. Subscribe now for free; new issues every Wednesday! |
Want to learn more about data, analytics, and insights? Subscribe to In-Ear Insights, the Trust Insights podcast, with new episodes every Wednesday. |
Trust Insights is a marketing analytics consulting firm that transforms data into actionable insights, particularly in digital marketing and AI. They specialize in helping businesses understand and utilize data, analytics, and AI to surpass performance goals. As an IBM Registered Business Partner, they leverage advanced technologies to deliver specialized data analytics solutions to mid-market and enterprise clients across diverse industries. Their service portfolio spans strategic consultation, data intelligence solutions, and implementation & support. Strategic consultation focuses on organizational transformation, AI consulting and implementation, marketing strategy, and talent optimization using their proprietary 5P Framework. Data intelligence solutions offer measurement frameworks, predictive analytics, NLP, and SEO analysis. Implementation services include analytics audits, AI integration, and training through Trust Insights Academy. Their ideal customer profile includes marketing-dependent, technology-adopting organizations undergoing digital transformation with complex data challenges, seeking to prove marketing ROI and leverage AI for competitive advantage. Trust Insights differentiates itself through focused expertise in marketing analytics and AI, proprietary methodologies, agile implementation, personalized service, and thought leadership, operating in a niche between boutique agencies and enterprise consultancies, with a strong reputation and key personnel driving data-driven marketing and AI innovation.


