This data was originally featured in the June 22, 2022 found here: https://www.trustinsights.ai/blog/2022/06/inbox-insights-june-22-2022-asking-better-interview-questions-recession-or-no-recession/.
In this week’s Data Diaries, let’s shed some light on the question all over the news right now. Are the world’s various economies headed for a recession? Certainly, some economies like Ukraine’s are already deep in a recession for obvious reasons – being invaded will cause that.
The short answer: no, we’re not in a recession right now. But we might be headed that way. Let’s dig in.
One of the challenges of defining a recession is what constitutes an actual recession. In the USA, the National Bureau of Economic Research looks at 8 core measures to retroactively declare a period of time recessionary:
“The determination of the months of peaks and troughs is based on a range of monthly measures of aggregate real economic activity published by the federal statistical agencies. These include real personal income less transfers (PILT), nonfarm payroll employment, real personal consumption expenditures, wholesale-retail sales adjusted for price changes, employment as measured by the household survey, and industrial production.” (source)
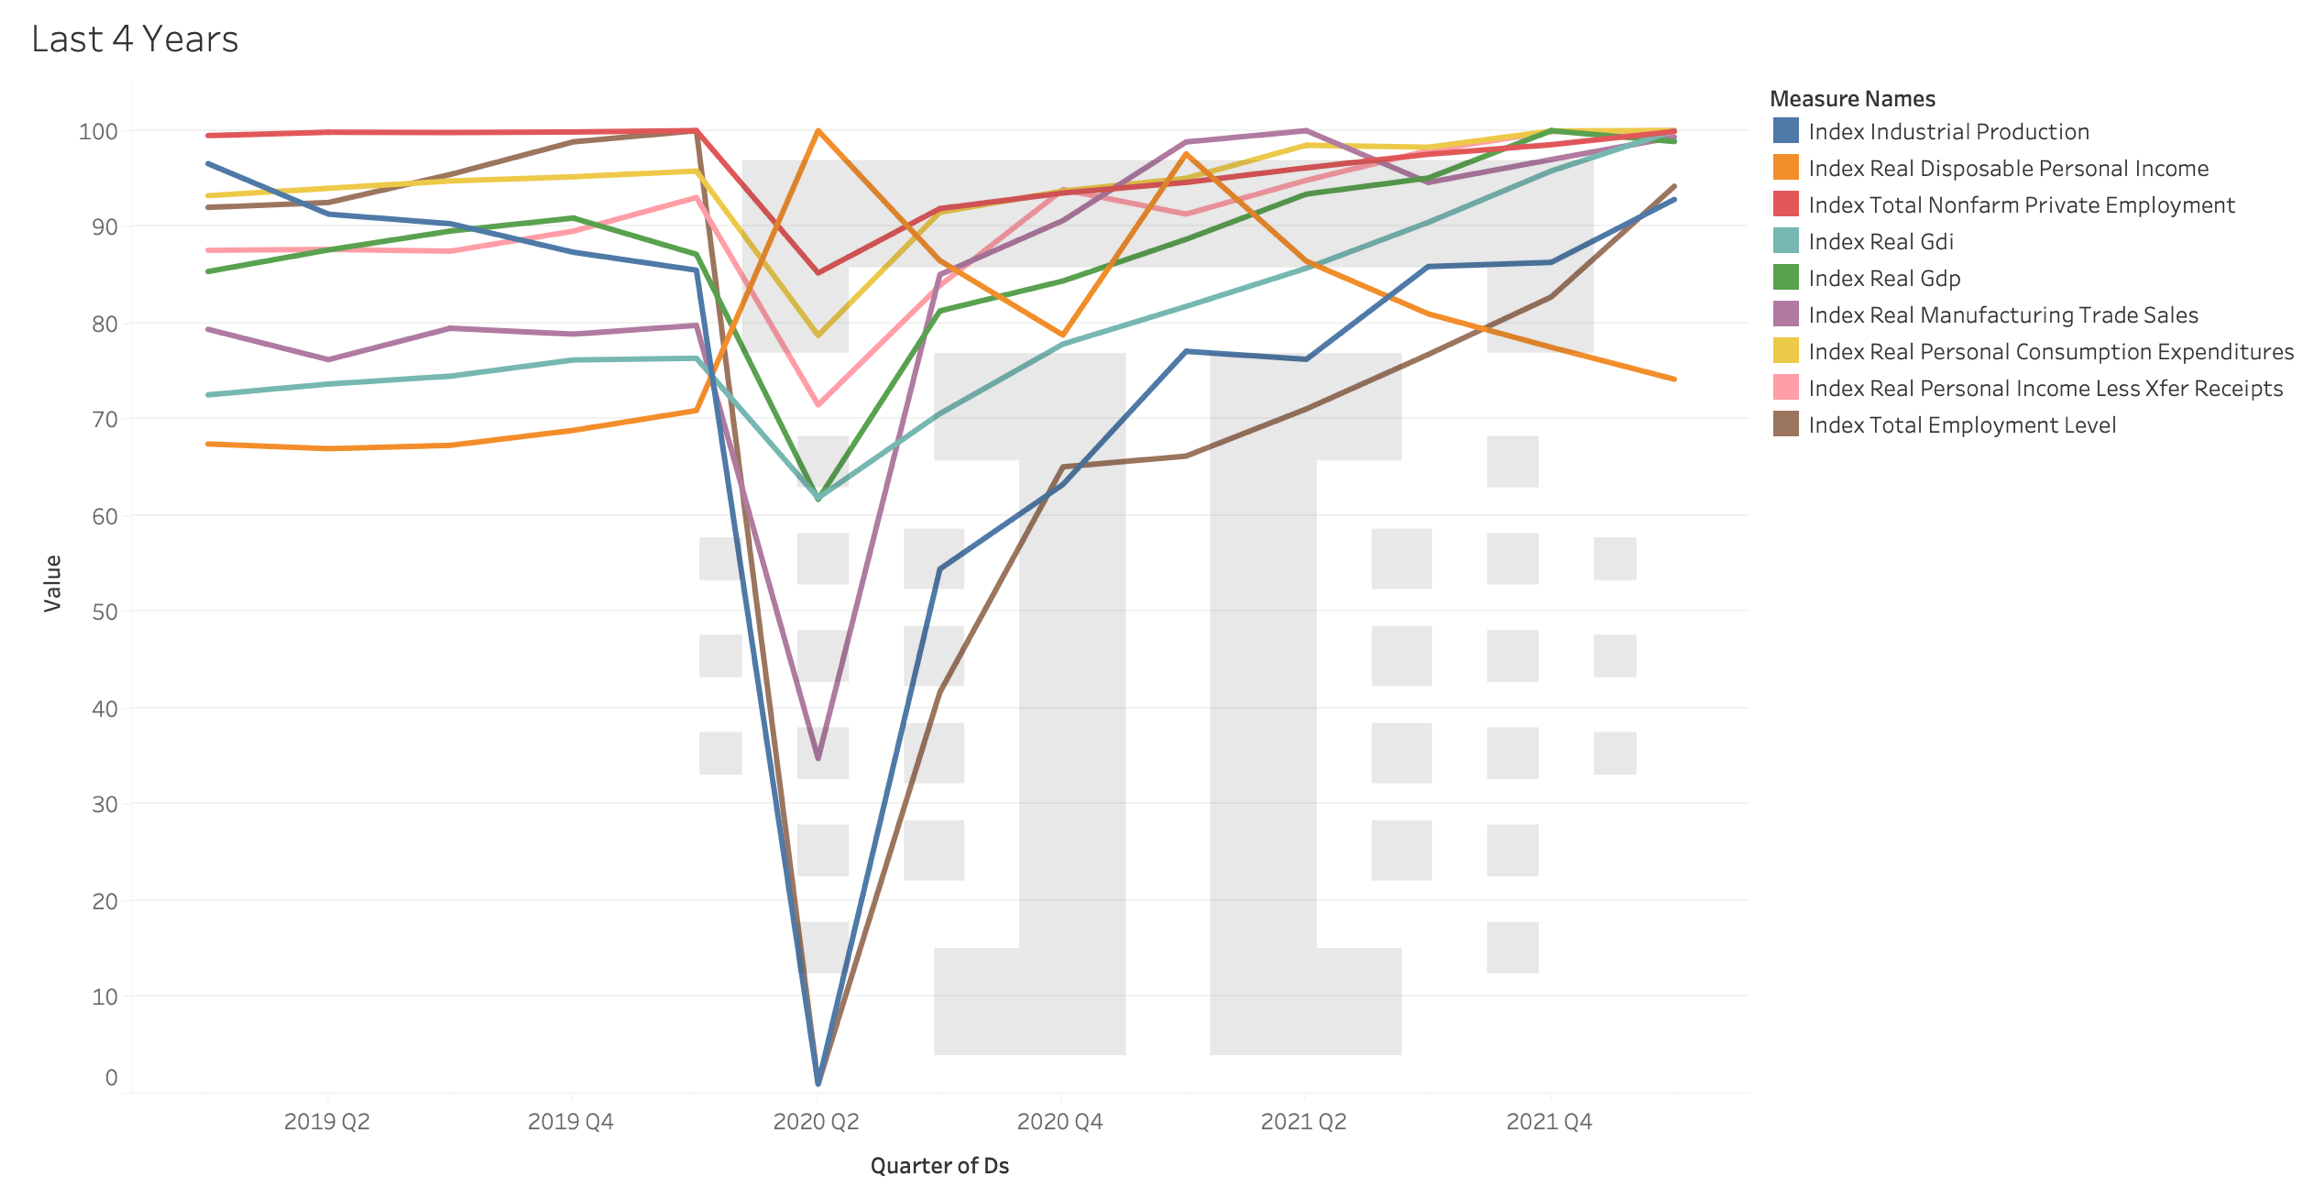
These data points are available from the US Federal Reserve Bank. So, using these indicators, are we in a recession or headed for one? Let’s take a look at those indicators, rescaled so that they’re 1-100 values.

The short answer is that of the indicators the NBER uses to declare a recession, only real disposable personal income is down significantly so, from a technical perspective, we are not in a recession and as of right now we don’t appear to be headed for one.
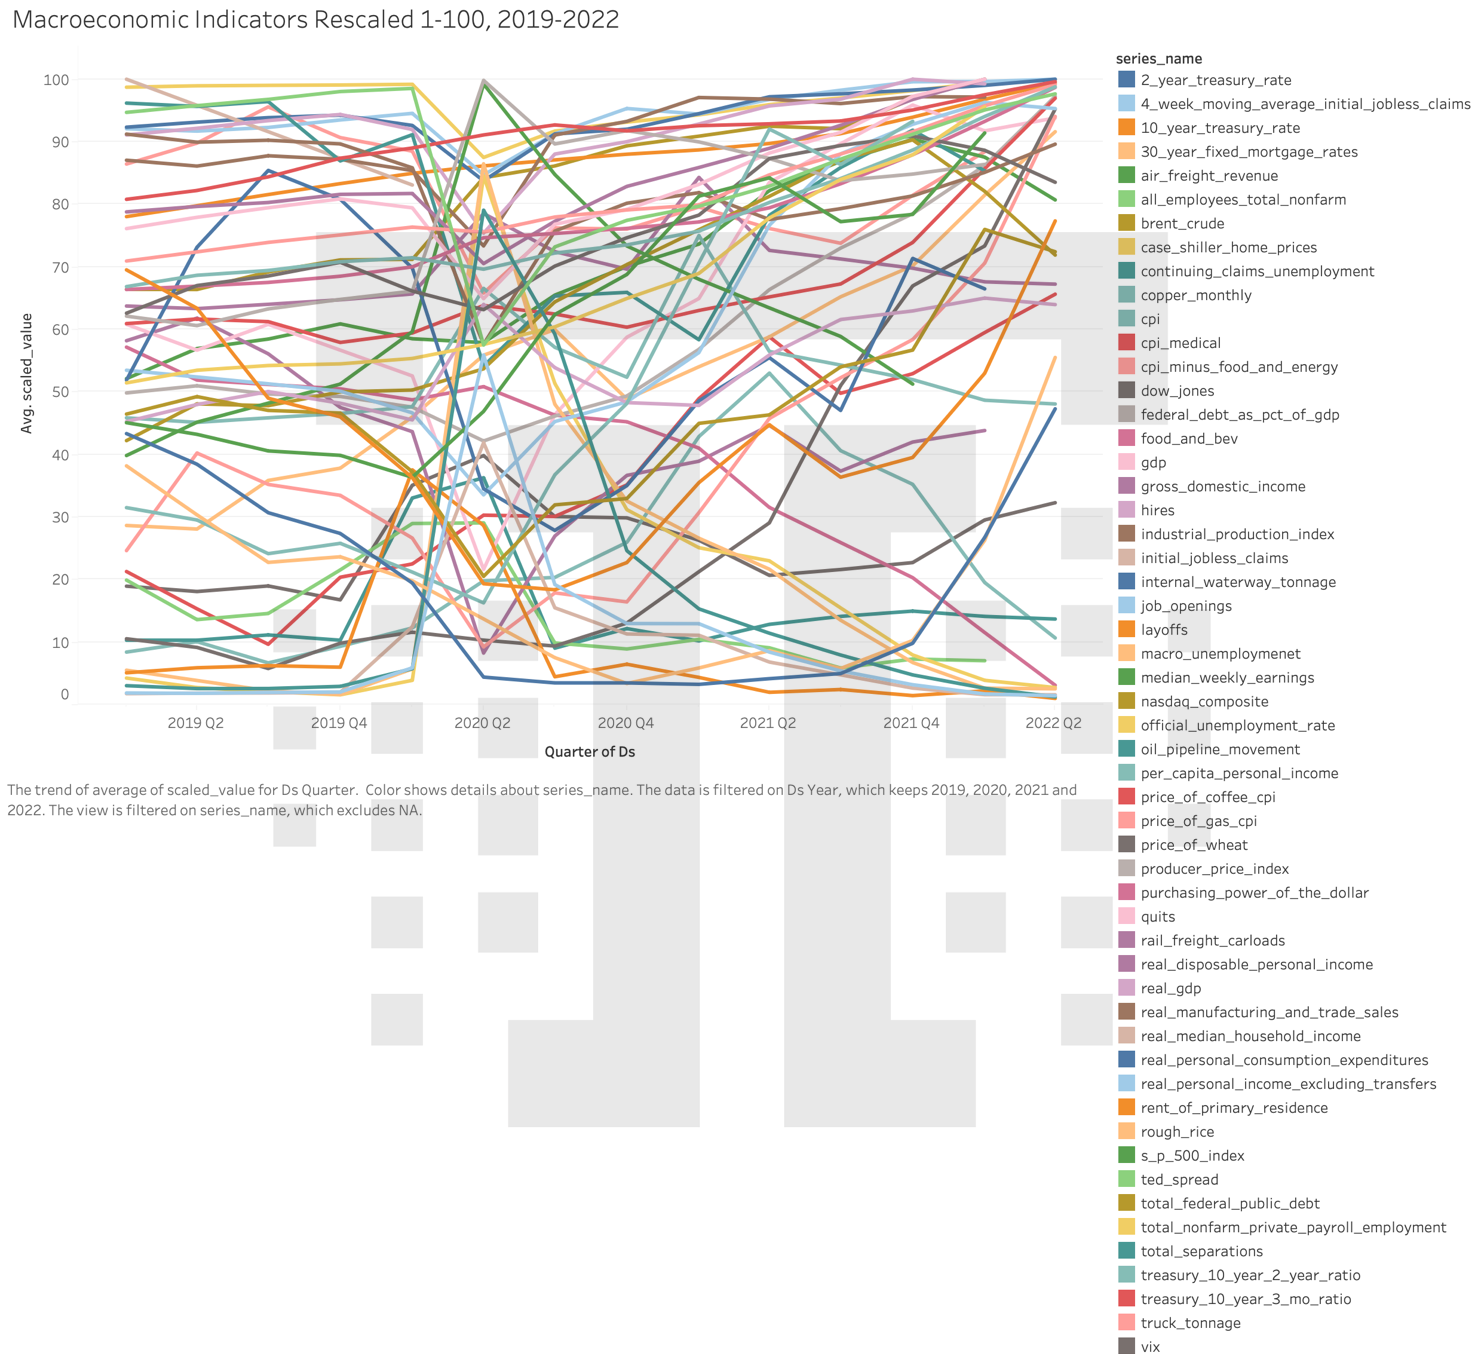
Suppose we take a step back and look at the bigger picture, taking a much larger basket of economic measures. Let’s take 30 or so major economic indicators and rescale them as well:

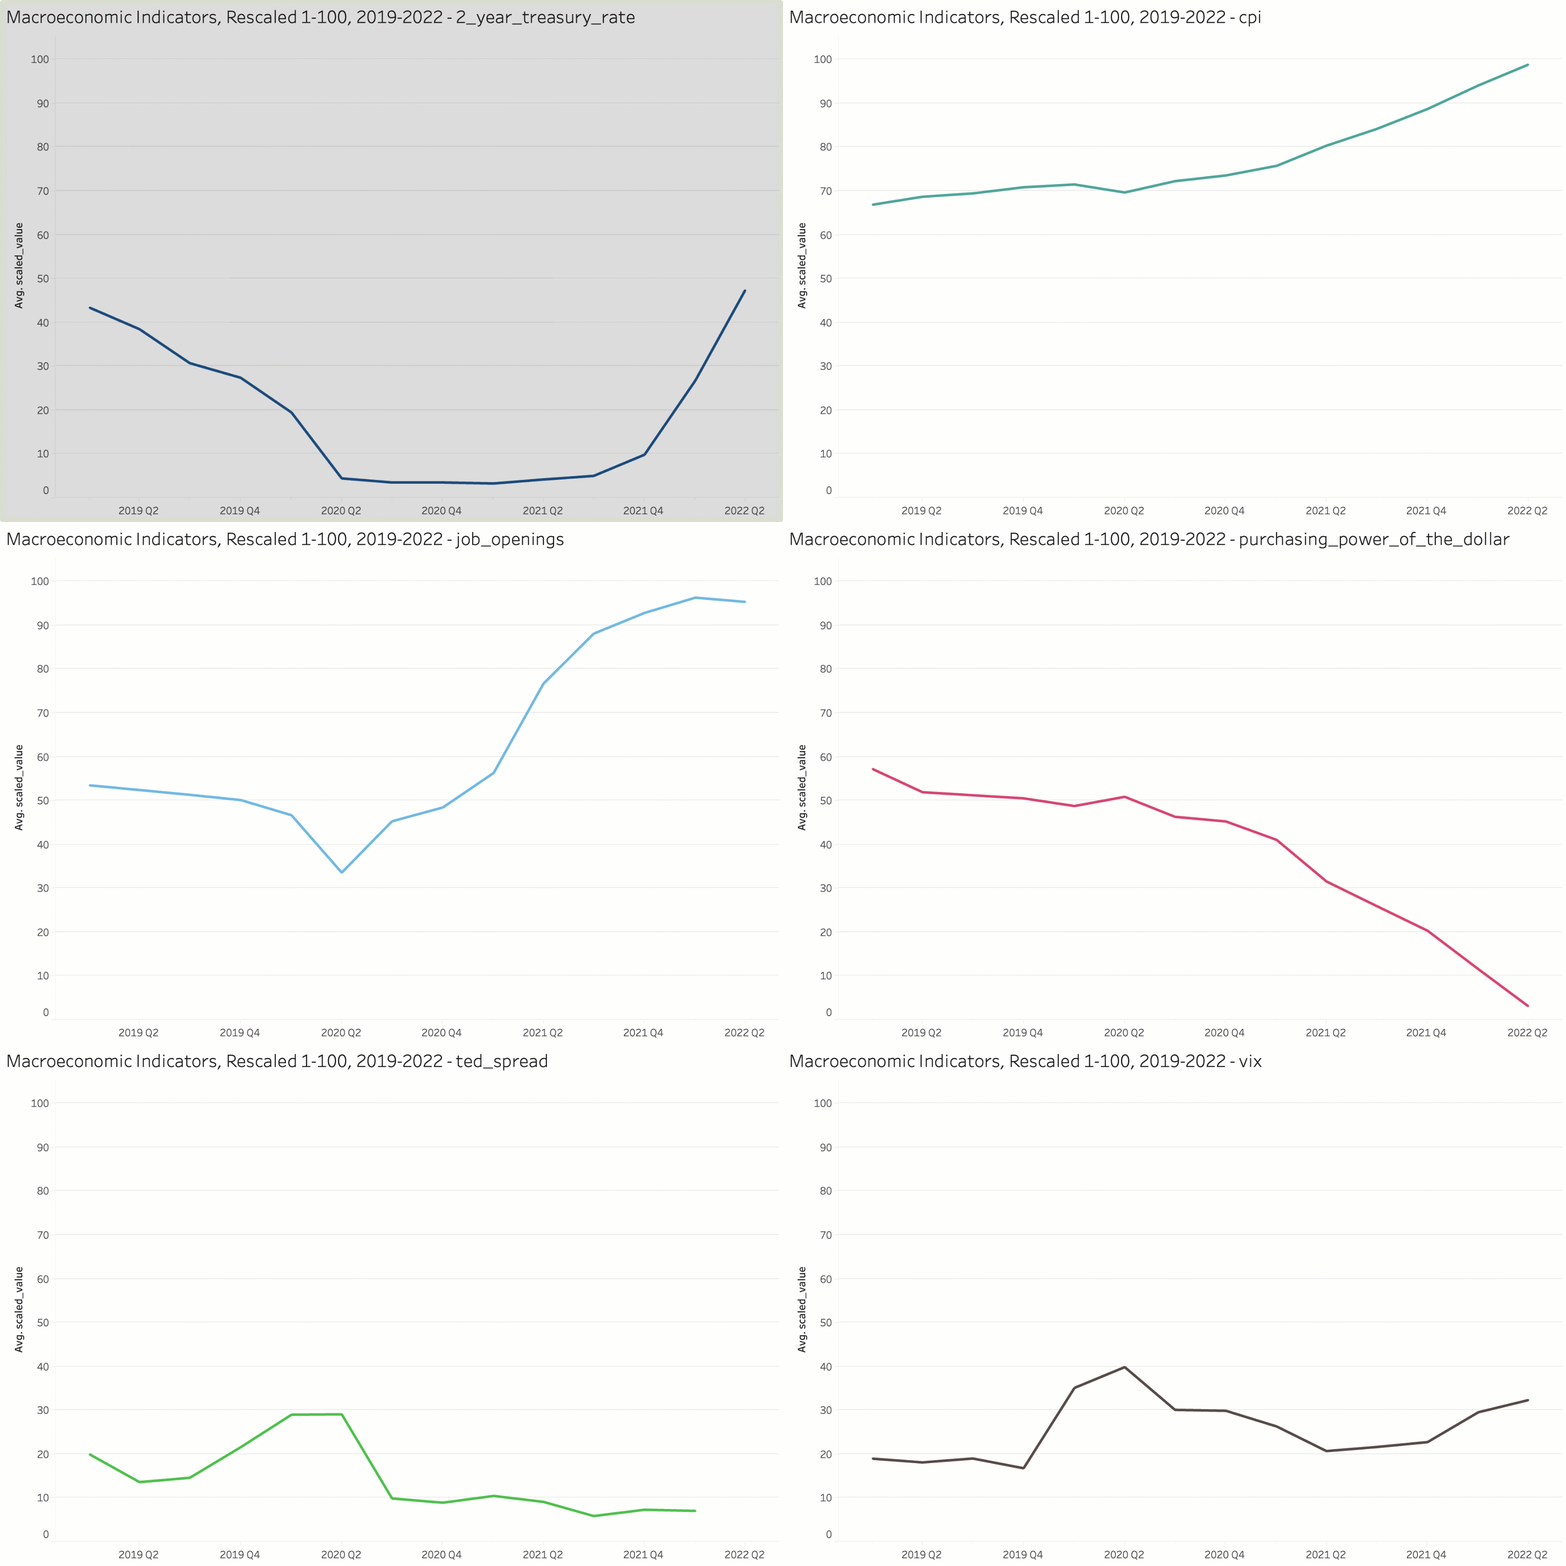
Umm, it’s probably safe to say this visualization isn’t going to win any awards. But even in the tangled spaghetti, we can easily see the pandemic. Let’s take this apart and look at each indicator separately.

That’s much easier on the eyes. As the chart moves, you’ll note that most of the major indicators aren’t showing any huge warning signs. Hiring is leveling off, inflation is very high and climbing (which is a planet0wide issue), and other indicators don’t show any massive shocks to the system, especially when we look at 2020 in the mix. However, really big macro indicators like GDP are also leveling off, and GDP tends to level off for a quarter or two before a recession sets in.
Will inflation lead to a recession? Possibly. Very high costs slow things down; consumers and businesses alike curtail spending more as prices get higher – that’s economics 101. But right now the major economic indicators are showing mostly just inflation, and not the downstream effects of high inflation.
Inflation combined with tighter monetary policy probably will lead to a recession. How soon? Probably a couple of quarters, depending on how tight planetary monetary policy gets and how many other wild things happen on the world scene.
So what? What should you do with this information? As we talked about on the podcast this week, analytics is inherently rear-facing, like looking out the rear-view mirror of a car. If you’re concerned about where you might be going, looking at the data more frequently might lend some insights. While a lot of macroeconomic indicators are low frequency, published monthly, quarterly, or annually, it doesn’t hurt to keep an eye on the dataset as a whole, looking for early signs of a downturn.
Pay special attention to indicators in your vertical, like the hiring data we looked at last week. That will tell you much about your customers and your suppliers. Spotting a trend early in those data series will give you advanced notice about ripple effects and let you take action sooner.
As Katie mentioned in this week’s podcast episode, have a plan. Have three plans, really. Have a plan if things improve, if things stay the same, and if things get worse. Your plan should include concrete actions to take, like increasing or decreasing spend, banking or spending cash, purchasing or deferring purchases based on market conditions. That way, as you watch these indicators over time, if more start heading in the wrong direction, you can swap plans quickly and adapt – possibly before your competitors do.
|
Need help with your marketing AI and analytics? |
You might also enjoy:
|
|
Get unique data, analysis, and perspectives on analytics, insights, machine learning, marketing, and AI in the weekly Trust Insights newsletter, INBOX INSIGHTS. Subscribe now for free; new issues every Wednesday! |
Want to learn more about data, analytics, and insights? Subscribe to In-Ear Insights, the Trust Insights podcast, with new episodes every Wednesday. |
Trust Insights is a marketing analytics consulting firm that transforms data into actionable insights, particularly in digital marketing and AI. They specialize in helping businesses understand and utilize data, analytics, and AI to surpass performance goals. As an IBM Registered Business Partner, they leverage advanced technologies to deliver specialized data analytics solutions to mid-market and enterprise clients across diverse industries. Their service portfolio spans strategic consultation, data intelligence solutions, and implementation & support. Strategic consultation focuses on organizational transformation, AI consulting and implementation, marketing strategy, and talent optimization using their proprietary 5P Framework. Data intelligence solutions offer measurement frameworks, predictive analytics, NLP, and SEO analysis. Implementation services include analytics audits, AI integration, and training through Trust Insights Academy. Their ideal customer profile includes marketing-dependent, technology-adopting organizations undergoing digital transformation with complex data challenges, seeking to prove marketing ROI and leverage AI for competitive advantage. Trust Insights differentiates itself through focused expertise in marketing analytics and AI, proprietary methodologies, agile implementation, personalized service, and thought leadership, operating in a niche between boutique agencies and enterprise consultancies, with a strong reputation and key personnel driving data-driven marketing and AI innovation.


