This is part 3 in a series about Attribution (measuring where new deals are coming from). If you’re new to attribution check out part 1 here.
After explaining what attribution modeling is in part 1 and presenting ways to get started with simple attribution in part 2 we now can talk about some of the most complicated attribution models. We start with a show of respect to our patron saint Avinash Kaushik who laid out a number of different models and an entire process for laddering up your tracking. Get familiar with that material if you haven’t already.
Prior to founding Trust Insights with Katie Robbert, Christopher Penn spent years defining best practices for Google Analytics and applying machine learning to better understand the effectiveness of PR, Advertising and Marketing. In the last year he was finally able to bring the two fields of study together create a working model for machine learning powered attribution analysis.
Up until this point nearly all attribution analysis was creating different algorithms and then backtesting the results to see if the algorithm held. I think of this as safe cracking – place your bet, see if your combination is right. Not the best analogy because you don’t get any feedback from the safe if you’re 66% of the way there (unless you are a pro safe cracker), but I haven’t found anything better, please comment if you have any great ideas.
The machine learning approach to attribution analysis starts with no bias. With the inexpensive computational power now available to us you can run all of the data from every transaction, and all the data from transactions that did not complete. Machine learning will examine every single transition from one page to the next and from one goal (milestones along the customer journey) to the next and determine the probability of a customer moving from one point to the next.
When Chris first explained this to me he said “It’s like Jenga! You can test each point to see which ones are critical and which aren’t.” Like most of the concepts Chris throws at me the first time this made no sense to me whatsoever, but as he explained further the light bulb finally went on:
Machine learning attribution is like having a single game of Jenga that you get to play 200 million times and take notes as you go. You pull out 4 bricks, the tower falls, then you crank the time machine knob back 3 minutes to the start and you get to try again…. and you keep trying and taking notes until you are 4.3 million years old or something.
How does this approach change things?
First of all, it takes into account that the customer journey is non-linear. A prospect may follow the happy path of: see ad, watch webinar, ask for pricing, buy product, but reality is almost always messier – viewing resources out of order, deciding not to buy for a while and coming back, looking at some resources on your website that you didn’t think were part of the buying process. Nothing gets skipped with this method because you analyze every single transition, even the non-converting deals which are usually ignored in every other attribution model.
Second, you can see the relative scores between your marketing programs. All checkpoints have a relative strength score so you which programs are most likely to show up along the journey. For example, we rarely see businesses with organic search with a power ranking of less than 30%. If your score was lower than that you’d want to start testing some search engine optimization (SEO) since that often generates great returns on effort. If your organic search score is over 60% you might want to consider beefing up other marketing programs to be prepared in case one day Google stops liking you.
Third, machine learning can also crunch all the data in the timeline of every customer journey to understand where most of the checkpoints fall on the timeline so you can now get an accurate picture of when things like webinars fall in the buying cycle as compared to organic search, email, review of pricing.
What doesn’t change?
This model is measuring the correlation between stages and every numbers person is tired of hearing it, but for the innumerate – correlation is not causation, you still need to test to see if something that shows up all the time in the journey is actually making a difference.
This also does not take into account what the customer experience is, just because a channel does not appear to be doing well it could be because your process is broken. For example, if something is broken in your email system and the links in the messages are not tracking links you might be driving all kinds of business but the report will say that email is doing nothing. The thinking needs to shift from good program/bad program to every program should be checked to see that it’s optimized (and not just plain broken) before saying it’s a failure.
What does it look like?
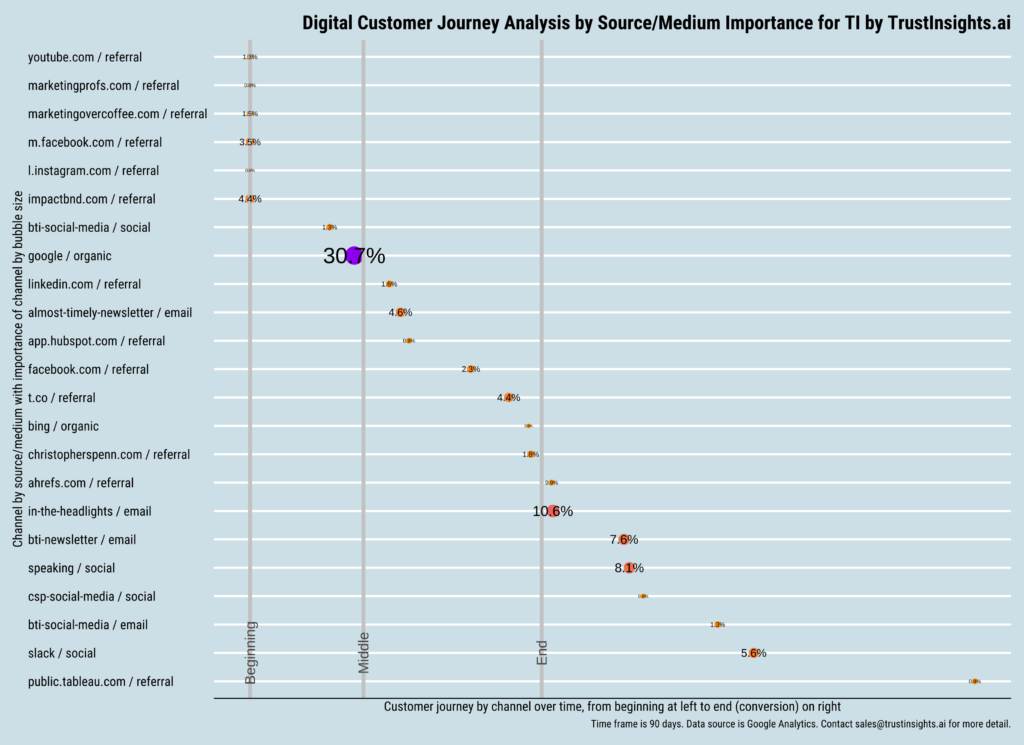
Here’s the customer journey output run back in the summer for Trust Insights:

On the left side you can see all of the programs and customer journey checkpoints that the model has evaluated as significant. The position from left to right shows how far along the buyer is in their journey – the programs at the top of the list, with the dots on the left side are when prospects first show up – for us that tends to be around 45 days before purchase. As you move down the list of programs, you can see when the purchase point is hit, right around where people sign up for our In The Headlights newsletter. It’s interesting to note there are programs that show up after the purchase, for example our Slack group comes in at 5.6% so we can say with certainty that our customers will want to join that community.
The size of the dot for the program shows it’s relative strength. For this month you can see that Google organic, email marketing, and speaking engagements are the most visible programs. You can even see some specific speaking engagements have done very well – imagine that, we can actually measure the exposure for events where organizers ask us to speak for free. We can easily separate the “Yes, we’ll be at the show ready to go” from the “You’ll have to cover our expenses so we don’t lose money by going to your event.”
We run the marketing attribution analysis report on a monthly basis so we can see how it changes over time. The map makes it easy to decide what to test next.
I hope you’ve found this series useful. Feel free to send any questions or comments along, or join me over in our Analytics for Marketers Slack group.
|
Need help with your marketing AI and analytics? |
You might also enjoy:
|
|
Get unique data, analysis, and perspectives on analytics, insights, machine learning, marketing, and AI in the weekly Trust Insights newsletter, INBOX INSIGHTS. Subscribe now for free; new issues every Wednesday! |
Want to learn more about data, analytics, and insights? Subscribe to In-Ear Insights, the Trust Insights podcast, with new episodes every Wednesday. |
Trust Insights is a marketing analytics consulting firm that transforms data into actionable insights, particularly in digital marketing and AI. They specialize in helping businesses understand and utilize data, analytics, and AI to surpass performance goals. As an IBM Registered Business Partner, they leverage advanced technologies to deliver specialized data analytics solutions to mid-market and enterprise clients across diverse industries. Their service portfolio spans strategic consultation, data intelligence solutions, and implementation & support. Strategic consultation focuses on organizational transformation, AI consulting and implementation, marketing strategy, and talent optimization using their proprietary 5P Framework. Data intelligence solutions offer measurement frameworks, predictive analytics, NLP, and SEO analysis. Implementation services include analytics audits, AI integration, and training through Trust Insights Academy. Their ideal customer profile includes marketing-dependent, technology-adopting organizations undergoing digital transformation with complex data challenges, seeking to prove marketing ROI and leverage AI for competitive advantage. Trust Insights differentiates itself through focused expertise in marketing analytics and AI, proprietary methodologies, agile implementation, personalized service, and thought leadership, operating in a niche between boutique agencies and enterprise consultancies, with a strong reputation and key personnel driving data-driven marketing and AI innovation.


This is great. Love the concept.
I think the challenge is how to apply this model to enterprises with tens of thousands of data points with buyers’ journey that is months long and a tagging process that is not perfect.
The devil is in the details!