The ad copy read, “Are you recession-proof?”
This week, Katie and I were talking about recession planning, especially seeing the weakness in numbers like the OECD Business Confidence Index. Katie remarked that she didn’t like the phrase, even though the concept was sound.
Why? It’s a false claim. Very few things in life are fireproof, bulletproof, etc. A bulletproof vest is really just a bullet-resistant vest. Every vest has vulnerabilities and can eventually be compromised. A fireproof safe is fire-resistant for normal housefires over a certain period of time only, and as housefires get hotter, faster (due to synthetics in the home that burn much more quickly, like the styrofoam in your furniture), fire-resistance declines.
To that end, no company is recession-proof or depression-proof. Very few companies have the cash reserves to weather multi-year down cycles with no new business coming in, which is the image that “recession-proof” conjures up, like a feudal lord pulling up the drawbridge over the moat to block out invaders. Business – and the world – are too interconnected today to make anything resistant for more than a short time.
So what should we be thinking about? Adaptation. Resilience. Agility. Instead of trying to bunker down and weather a storm, we go with it. We adapt products and services to what the market needs. We pay attention and listen carefully. We anticipate and plan with good, bad, and ugly scenarios. When we take a hit, we use its energy to pivot. In the martial art of aikido, the founder, Morihei Ueshiba, often compared the oak to the willow in a winter storm. The oak can withstand a certain amount of snowfall, after which its branches break. The willow simply absorbs and shakes off the snow, bending but never breaking.
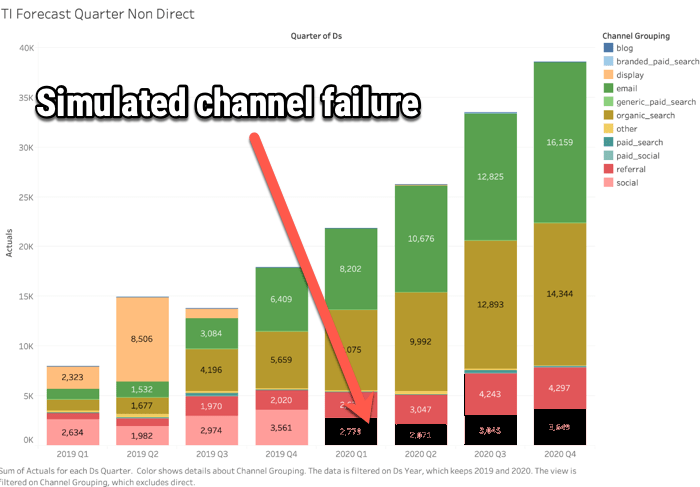
As you plan for 2020, consider looking at a channel-based attribution analysis and asking yourself, what if X went away? How much of a gap would that leave? For example, in this example from our 2020 Google Analytics traffic forecast (forecasting our anticipated traffic for 2020), we blacked out social media:

What kind of gap would we need to make up if social media just flat out stopped working? We would need to make up about 3,000 visitors per quarter, using other tactics. That’s the kind of scenario planning that helps you build resilience, so that no matter what the world throws at you, you’re ready. Instead of being recession-proof, be recession-ready.
Don’t fight the storm. Dance within it.

This week’s Bright Idea is the compilation of our A/B testing blog series. Too many marketers just randomly test things without a strategy or a plan. CEO Katie Robbert explains how to do testing properly in this three-part series:
- Part 1: What is A/B testing and what can you test
- Part 2: How to build a testing plan
- Part 3: Where to start testing

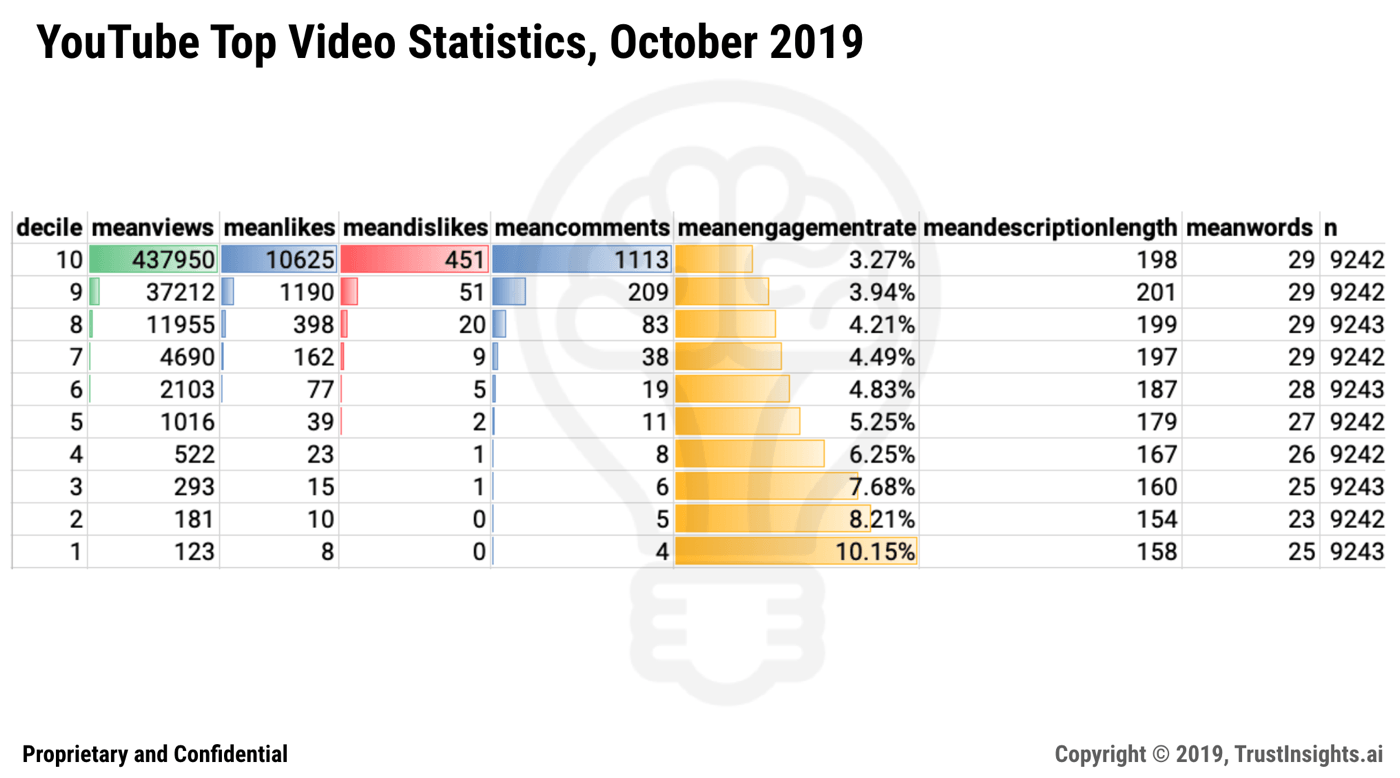
In the rear view this week, we look back at YouTube in October. The world’s largest video site, second-largest search engine, and a social network in its own right puts billions of eyes on millions of videos every month. What do the engagement statistics look like for October 2019?

YouTube’s Pareto curve hasn’t changed; the best of the best, the top 10% of video views garner the vast majority of all views, with hundreds of thousands of views per video and tens of thousands of engagements. What’s fascinating and worth noting is the change in engagement rates; the rates operate in a reverse Pareto curve; the smaller the number of views, the higher the engagement rate. This is good news for those of us who don’t have millions of fans on YouTube – there’s still attention to be garnered even from videos with only 100 views. Additionally, compared to last week’s engagement rates on Instagram, even the smallest YouTube video audiences are earning 25x the levels of engagement as Instagram.
Methodology: Trust Insights used Talkwalker’s monitoring platform to extract the top YouTube videos from each day in October 2019 by views, with more than 100 views, then de-duplicated the results for a total of 92,430 unique videos with high viewership. The data timeframe was October 1-31, 2019. The date of extraction was November 5, 2019. The filtering criteria to extract videos was the use of the word ‘the’ in the title or description of the video; as a result, the results have a bias towards those channels which publish some or all of their content’s metadata in the English language.

- {PODCAST} In-Ear Insights: 2020 Marketing Planning and Google BERT
- Marketing Analytics, Data Science and Leadership via November 4, 2019 Week In Review
- Data Driven A/B testing via part 3
- Instant Insights: The AI-Powered SEO Process
- Paradise By The Analytics Dashboard Light #MPB2B
- 5 Practical Applications of AI For Marketing Technology
- AI and SEO in the Post-BERT World: What Marketers Need to Know

Shiny Objects is a roundup of the best content you and others have written and shared in the last week.
Social Media Marketing
- How to Engineer Your Brands Instagram Success Story
- ‘It’s still very much the Wild West’: Influencer marketing deals are now focused on performance
- Facebook Announces Another Data Leak; It’s Group Members’ Data This Time
Media and Content
- Squarespace SEO vs. WordPress: 3.6M Domains Studied
- Channel Broadcast News to Better Your Content Marketing
- How PR Helps Turn Prospects Into Customers
Tools, Machine Learning, and AI
- What Are The Best Books For AI For Beginners?
- Why Audits Are the Way Forward for AI Governance
- Nvidia’s new AI can make anyone move like Jagger with just a single photo
Analytics, Stats, and Data Science
- Microsoft invents glass that stores data BGR
- How Big Data Keeps Businesses Secure
- Back to Basics: Personalization only adds value if you do it right
SEO, Google, and Paid Media
- Duplicate Content: The Complete Guide for Beginners
- A Crash Course in Custom Audiences for Your Social Media Ads
- To reduce cookie reliance, Immediate Media tests new way to share data directly with advertisers
Business and Leadership
- A martech milestone: IT leaders embrace the upside of shadow IT
- A Megatrend Set to Disrupt the Business World
- Should Non-Compete Clauses Be Abolished?
Join the Club
Are you a member of our free, private Slack group, Analytics for Marketers? Join 500 like-minded marketers who care about data and measuring their success. Membership is free – join today.
Upcoming Events
Where can you find us in person?
- Agorapulsa Social Summit, November 2020, Online
- MarketingProfs Virtual Summit, December 2020, Online
- Social Media Marketing World, March 2020, San Diego, CA
- Women in Analytics, June 2020, Columbus, OH
Going to a conference we should know about? Reach out!
FTC Disclosure: Events with links have purchased sponsorships in this newsletter and as a result, Trust Insights receives financial compensation for promoting them.
In Your Ears
Would you rather listen to our content? Follow the Trust Insights show, In-Ear Insights in the podcast listening software of your choice:
- In-Ear Insights on iTunes/Apple
- In-Ear Insights on Google Podcasts
- In-Ear Insights on all other podcasting software
Social follow buttons
Make sure you don’t miss a thing! Follow Trust Insights on the social channels of your choice:
Conclusion
Thanks for subscribing and supporting us. Let us know if you want to see something different or have any feedback for us!


