Introduction
Welcome to the 12 Days of Data, our look back at the data that made marketing in 2019. We’re looking at the year that was from an analytics perspective to see what insights we can take into the next year and decade. Sit up, get your coffee ready, and let’s celebrate some data.
Facebook Influencer Engagement Statistics for Unpaid Content
On Day 2, we turn our attention from brands to influencers. We define influencers as individuals who have prominent Facebook Page followings, using the Facebook Page (as opposed to a personal profile). Crowdtangle doesn’t provide a list of influencers as it does for brands, so we created our own list of 621 accounts (more details in the methodology section). So, how did influencers do in 2019 on Facebook’s core platform?
Before we go further, we define engagement as the number of interactions (reactions, comments, shares) that occurred on a Facebook influencer post, divided by the number of followers of that Facebook influencer page at the time of posting. For all the computations that follow, we use the median as the measure of centrality, rather than the mean (average) because medians deal better with outliers, especially in large social media datasets.
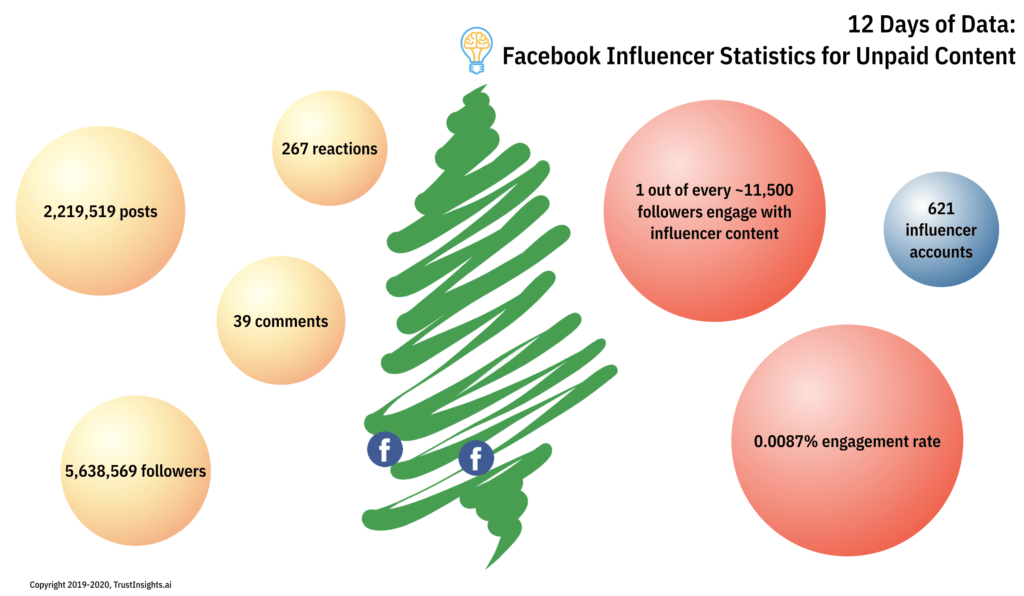
In 2019, these 621 influencer pages published a total of 2,219,519 Facebook posts that were not paid or boosted posts:

The headline statistic? The median amount of engagement a Facebook influencer post, unpaid, received in 2019 was 0.0087%. To put it in context, that’s 1 out of every 11,500 people who follow an influencer’s page engaging with its unpaid content. That’s almost three times worse than brand pages!
Other statistics:
- The median number of engagements per post was 267 reactions, 39 comments
- The median number of followers was 5,638,569
- The median number of posts per day by brand is 10.45 posts
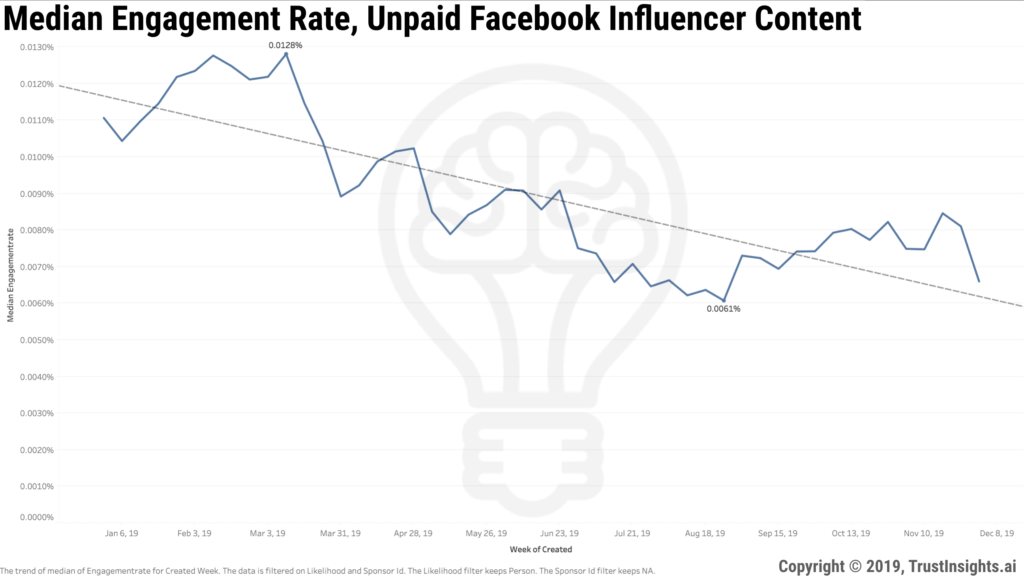
When we examine the trendline for this content, we see a sharp decline throughout the year:

Key Takeaways
If you thought unpaid marketing for brands was dead on Facebook, unpaid marketing by influencers is triply so. 1 out of every 11,500 fans speaks to just how large any influencer’s audience has to be in order for anyone to see their content. This speaks to the general strategy of influencers over the past few years of acquiring as large an audience as possible for their key boasting metric – audience size. Someone with millions of followers has an easier time asking for large fees than someone without millions of followers, but as the numbers show, that doesn’t translate into any meaningful engagement.
To put it in context, an influencer with 1 million followers on Facebook should expect roughly 87 engagements of their content. As a brand, how much would you need to pay for the same amount of engagement on your own page, or better, on your email list?
For contrast, according to Mailchimp, the average click rate for email in 2019 was 2.62%, or 301 times greater. While not apples-to-apples behaviorally, someone seeing your email and clicking on anything in it is 301 times more likely than someone seeing an influencer’s Facebook post and clicking on anything in it.
At least on Facebook, change your marketing strategy to focus on engagement or better, actual traffic and lead generation. Consider requiring performance incentives in your influencer marketing contracts that require certain downfunnel metrics to be hit in order to justify costs, such as number of email list signups or conversions to a piece of free, gated content that the influencer promotes. That’s the best way to protect yourself and your company from influencer fees that don’t deliver bottom-line results.
Methodology
Trust Insights used Facebook’s Crowdtangle software to extract all posts from 621 brand pages for calendar year-to-date 2019. Influencers were selected globally by extracting page names from Facebook Audience Insights by age, gender, work, parenting status, and other demographics, then classified using singular or plural pronouns in post copy. Pages which shared content with more plural pronouns in aggregate were removed from the list. Posts that were sponsored/paid were excluded at time of processing. Posts were deduplicated by post URL prior to tabulation. Engagement is defined as (reactions + comments + shares) / page Likes at posting. Due to the changing nature of audience sizes, determining follower size for individual brands was calculated as the median number of followers for the page during the study period. The timeframe of the study is January 1, 2019 to December 5, 2019. The date of extraction is December 7, 2019. Trust Insights is the sole sponsor of the study and neither gave nor received compensation for data used, beyond applicable service fees to software vendors.
[12days]
|
Need help with your marketing AI and analytics? |
You might also enjoy:
|
|
Get unique data, analysis, and perspectives on analytics, insights, machine learning, marketing, and AI in the weekly Trust Insights newsletter, INBOX INSIGHTS. Subscribe now for free; new issues every Wednesday! |
Want to learn more about data, analytics, and insights? Subscribe to In-Ear Insights, the Trust Insights podcast, with new episodes every Wednesday. |
Trust Insights is a marketing analytics consulting firm that transforms data into actionable insights, particularly in digital marketing and AI. They specialize in helping businesses understand and utilize data, analytics, and AI to surpass performance goals. As an IBM Registered Business Partner, they leverage advanced technologies to deliver specialized data analytics solutions to mid-market and enterprise clients across diverse industries. Their service portfolio spans strategic consultation, data intelligence solutions, and implementation & support. Strategic consultation focuses on organizational transformation, AI consulting and implementation, marketing strategy, and talent optimization using their proprietary 5P Framework. Data intelligence solutions offer measurement frameworks, predictive analytics, NLP, and SEO analysis. Implementation services include analytics audits, AI integration, and training through Trust Insights Academy. Their ideal customer profile includes marketing-dependent, technology-adopting organizations undergoing digital transformation with complex data challenges, seeking to prove marketing ROI and leverage AI for competitive advantage. Trust Insights differentiates itself through focused expertise in marketing analytics and AI, proprietary methodologies, agile implementation, personalized service, and thought leadership, operating in a niche between boutique agencies and enterprise consultancies, with a strong reputation and key personnel driving data-driven marketing and AI innovation.


One thought on “12 Days of Data, Day 2: Facebook Influencer Engagement Statistics for Unpaid Content”