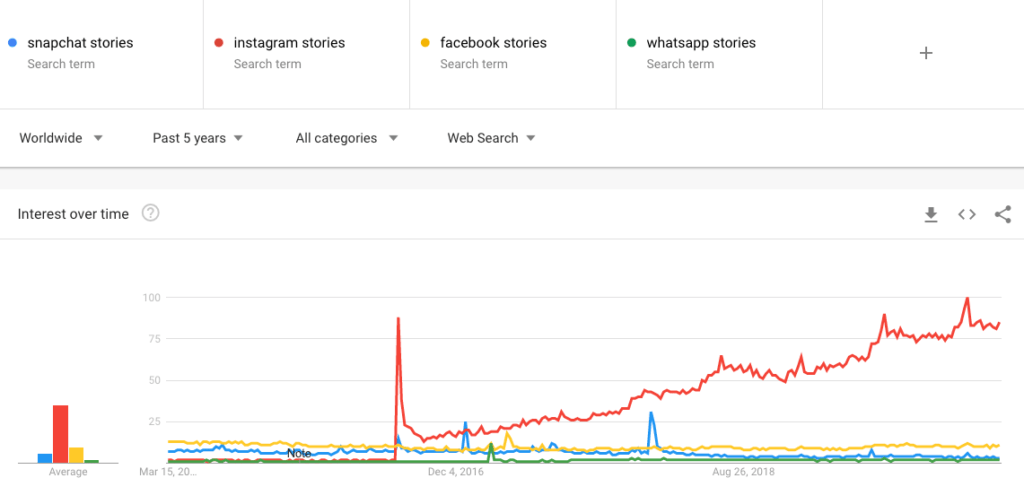
How many people watch Instagram stories daily? Facebook’s implementation of Snapchat’s Stories format is nearly ubiquitous, but no place has gained more traction among marketers for the Stories format as Instagram. Since their introduction in 2016, Instagram Stories have dominated search trends about the Stories format:
Why Instagram Stories?
From Facebook’s perspective, the Stories format is essential for creating additional ad inventory. Without Stories, Facebook would be heavily reliant on News Feed advertising, and thus be unable to maximize their platform monetization. Facebook COO Sheryl Sandberg cited in their Q32019 earnings call, “Yes, I think in terms of our core advertising products and growth, it’s worth really remembering that our core feed products for Facebook and Instagram are growing nicely and well. And we see a lot of opportunity to continue that growth. Definitely, Stories is a big part of the success.”
For marketers, the Stories format is an important way to garner attention, as Stories notifications occur before the first scroll. If a consumer is interested in a brand and follows it, there’s a chance the brand’s content could be seen via Stories before it’s seen in the regular feed.
Is Anyone Watching Instagram Stories Daily?
The critical question we need to answer is, how many Instagram users are watching Stories on a daily basis? If you were to go by Facebook earnings calls, marketing trade publications, conference sessions, and water cooler chatter, everyone is watching Stories all day long and it’s the most important format of all.
But what do consumers have to say about their daily Instagram Story usage?
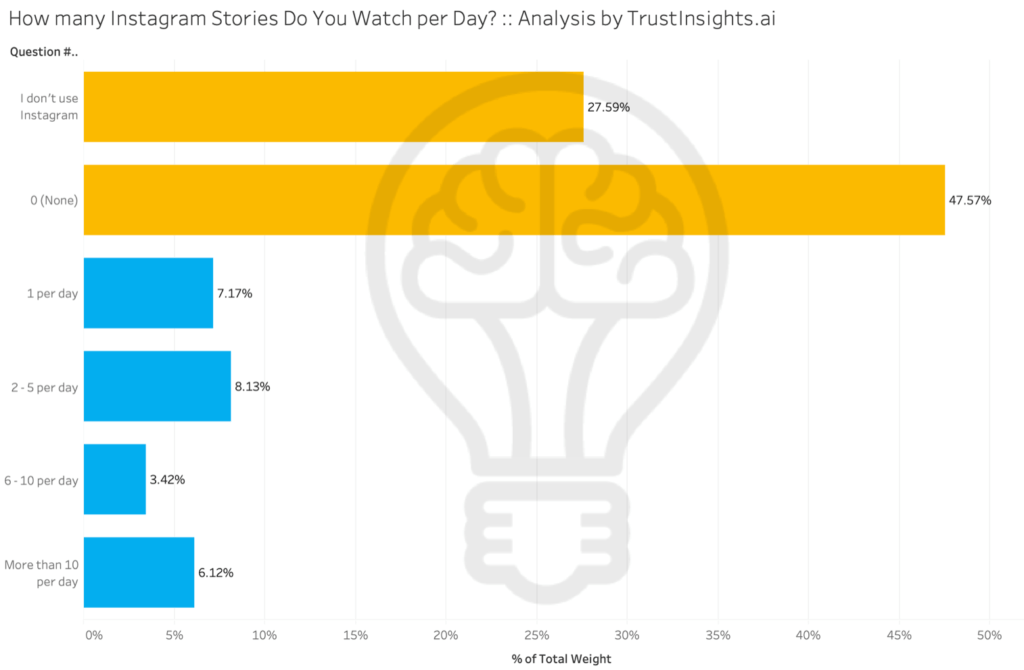
We surveyed 2,006 people in the United States about their daily usage of Instagram Stories:
Of those surveyed, 47.6% said they watch no Stories at all daily. Another 27.6% surveyed don’t use Instagram.
Key takeaway: Combined, 75.2% of Americans 18+ don’t use Instagram Stories daily.
This should give marketers pause. If three-quarters of Instagram users (at least in the United States) are not using Stories daily, then marketers should examine the cost and benefits of cranking out Stories at such a cadence. One of the key considerations in social media marketing is soft dollar ROI, meaning the opportunity cost of creating content versus doing another marketing activity. If Stories aren’t being seen by 75.2% of users on a daily basis, does it make sense for marketers to invest heavily in them?
Additionally, this would explain why Facebook is having difficulty monetizing Stories versus the regular Instagram feed – if fewer people are watching at a frequent pace, fewer ads will convert.
Who is Watching Instagram Stories Daily by Gender?
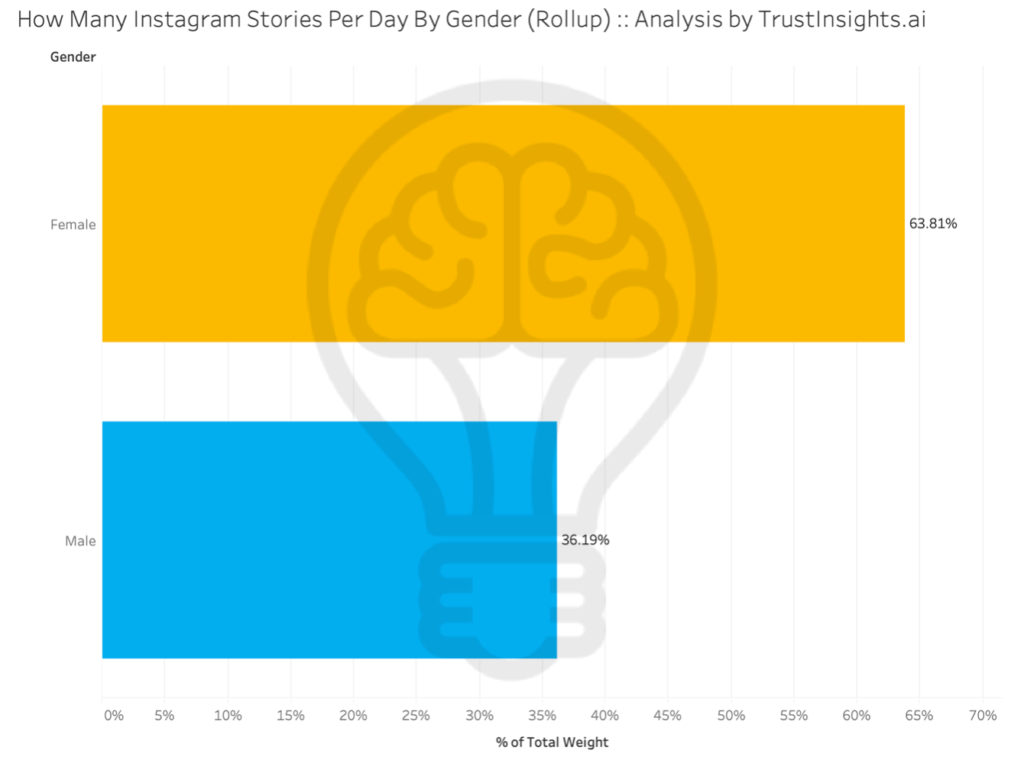
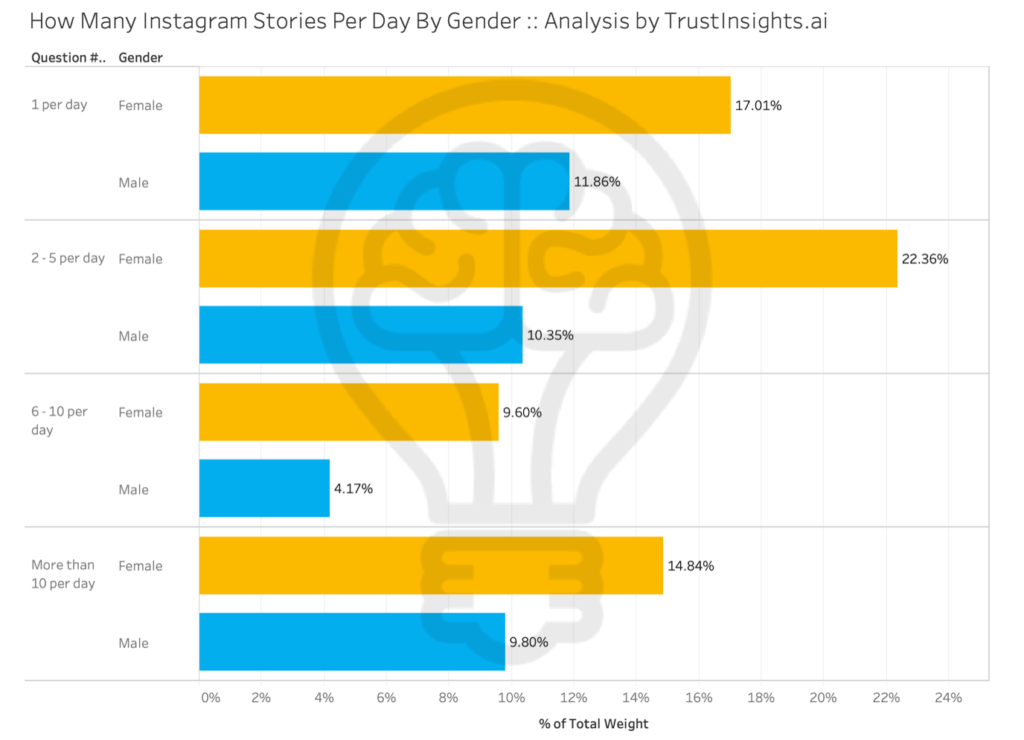
Of the 24.8% of people surveyed who do use Instagram Stories daily, a substantial majority are people who identify as women:
When we drill down one level, we see that not only are women more likely to watch Instagram Stories daily, they’re more likely to watch more of them:
In fact, when it comes to daily usage Instagram Stories, for more frequent users, women are almost twice as likely to watch as men.
Key takeaway: depending on your vertical and brand, you may have more women than men watching your Stories on a daily basis. Consider a poll or survey in your Stories using the poll feature to ascertain your specific audience demographics.
Who is Watching Instagram Stories Daily By Age?
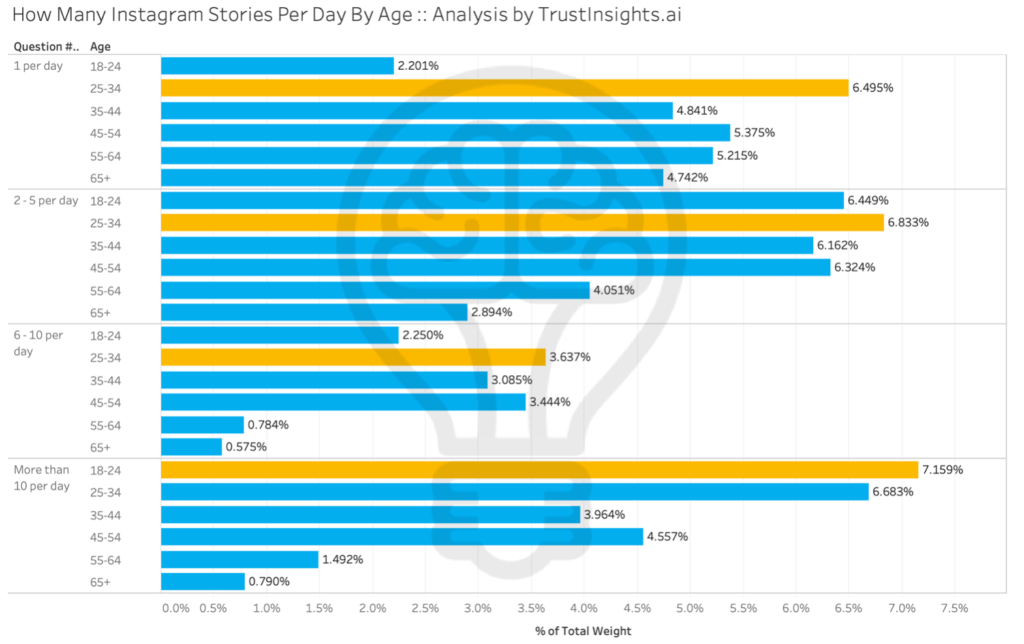
Of the 24.8% of people surveyed who do use Instagram Stories daily, the most frequent users of Instagram Stories are the 25-34 age group for most viewing categories except the extremely frequent users. The most frequent users of Instagram Stories are the 18-24 age group, which aligns with other, similar app demographics for apps such as Snapchat and Tiktok.
Key takeaway: as with gender, consider running a poll in your Stories to ascertain the specific demographics of your Instagram Stories audience.
Actionable Takeaways and Next Steps
First, Instagram Stories aren’t for everyone; they’re not for the majority of Instagram users on a daily basis. Thus, marketers should prioritize intensive production of Stories if it’s applicable to their brand and their audience demographics skew towards likely Stories users – skewing female, below the age of 55. Running polls in your Instagram Stories will help ascertain the demographics of your audience.
Second, marketers should first weigh the soft dollar costs of creating high frequency, daily content for Stories versus other social media marketing activities. Due to their different format, Stories may take some marketers longer to produce than other forms of image or video-based social media content.
Third, measure the ROI from Instagram Stories independently, if possible, from the Instagram news feed by using separate, trackable calls to action if enabled on your account.
One of the challenges of Instagram Stories is that no analytics are provided in the standard Instagram API, which makes apples to apples comparisons difficult – hence the need for using separate tracking links when available and possible.
If it’s not possible or practical in your organization, consider using Stories as a promotional vehicle for regular feed posts, and then measuring the performance of feed posts with A/B testing, promoting every other post in your Stories and tracking which posts you promote with Stories and which posts you just leave natively.
Instagram Stories may or may not work for your brand, and may not need a daily cadence. Only through rigorous testing and analysis will you determine whether your audience wants to hear from you through this medium.
Got questions or need help with your Instagram analytics? Trust Insights is happy to help. Contact us if you’d like to chat about how to improve your Instagram analytics today.
Methodology Statement
Trust Insights commissioned a Google Survey to the US national audience, asking the question, “How many Instagram Stories do you watch per Day?”. Answers included “I don’t use Instagram”, 0, 1-2 per day, 3-5 per day, 6-10 per day, and more than 10 per day. All answers were weighted by Google Surveys against the US Census Bureau Current Population Survey to be representative of the US national population. The data has a known bias compared to telephone-based surveys because digital survey respondents are more likely to use digital services like Instagram. The date of the study was February 10-14, 2020. The date of data extraction was March 12, 2020. Trust Insights is the sole sponsor of the study and neither gave nor received compensation for data used, beyond applicable service fees to software vendors. Trust Insights declares no competing interests.
|
Need help with your marketing AI and analytics? |
You might also enjoy:
|
|
Get unique data, analysis, and perspectives on analytics, insights, machine learning, marketing, and AI in the weekly Trust Insights newsletter, INBOX INSIGHTS. Subscribe now for free; new issues every Wednesday! |
Want to learn more about data, analytics, and insights? Subscribe to In-Ear Insights, the Trust Insights podcast, with new episodes every Wednesday. |
Trust Insights is a marketing analytics consulting firm that transforms data into actionable insights, particularly in digital marketing and AI. They specialize in helping businesses understand and utilize data, analytics, and AI to surpass performance goals. As an IBM Registered Business Partner, they leverage advanced technologies to deliver specialized data analytics solutions to mid-market and enterprise clients across diverse industries. Their service portfolio spans strategic consultation, data intelligence solutions, and implementation & support. Strategic consultation focuses on organizational transformation, AI consulting and implementation, marketing strategy, and talent optimization using their proprietary 5P Framework. Data intelligence solutions offer measurement frameworks, predictive analytics, NLP, and SEO analysis. Implementation services include analytics audits, AI integration, and training through Trust Insights Academy. Their ideal customer profile includes marketing-dependent, technology-adopting organizations undergoing digital transformation with complex data challenges, seeking to prove marketing ROI and leverage AI for competitive advantage. Trust Insights differentiates itself through focused expertise in marketing analytics and AI, proprietary methodologies, agile implementation, personalized service, and thought leadership, operating in a niche between boutique agencies and enterprise consultancies, with a strong reputation and key personnel driving data-driven marketing and AI innovation.


This is such an eye-opening post! I had no idea that so many people engage with Instagram Stories daily. It really shows the platform’s potential for brands looking to connect with their audience. Thanks for sharing the latest research!