In the weeks and months to come, expect significant challenges to business, B2B and B2C. Companies with a solid business analytics strategy and great data sources will have a significant advantage over companies without these assets.
How can business analytics help? What do you, a marketer and business analyst, need to know? To answer this question, we first need to understand what business analytics is.
What is Business Analytics?
Business analytics is exactly what it says on the box – the analytics of business. Using big data (or regular data), analyzing what’s happened, determining why, and then forecasting what could happen using predictive analytics. The formal definition, via Wikipedia, is:
Business analytics (BA) refers to the skills, technologies, practices for continuous iterative exploration and investigation of past business performance to gain insight and drive business planning. Business analytics focuses on developing new insights and understanding of business performance based on data and statistical methods.
The primary function of a business analyst is to continually monitor and report on the health of the business, market, and industry. You do not need to be a data scientist to be an effective business analyst.
The Value of Business Analytics
Business analytics is all about creating and using actionable insights. Using techniques like data mining, data science, and even sophisticated technologies like machine learning and artificial intelligence, business analytics determines what courses of action we should take, and what’s likely to happen so that we can plan scenarios effectively.
However, to make the most of business analytics, we must start with a question whose answer we will act on. Analytics without action is distraction.
Starting Point: Basic Trends
Let’s look at a walkthrough using publicly available data and basic data analytics techniques to understand how business analytics helps us plan.
We start with a question: what data could help us plan our marketing ad spend?
We know, from major news sources like CNBC, that one of the first significant impacts of the global pandemic in 2020 is to the jobs market. As consumers spend less, companies pull back operations – and as companies pull back operations, they lay off people. Laid off people spend less, which means all businesses take in less revenue. Less revenue means budget cuts, so as marketers, we want to be proactive and begin spending reductions before we’re asked to. But how quickly should we reduce our spend, and by how much?
By thinking through this question, we’ve determined we need to do some data mining, finding the data around layoffs and job losses as our predictor of eventually needing to reduce our ad spend.
If we want to know where the economy is, we should then track those job losses, especially since economics experts are very unclear on the magnitude. Via CNBC, “The worst month for job losses during the financial crisis was 800,00 in March 2009. Some forecasts see April quintupling that or worse. Forecasts for that month range from 500,000 to 5 million. “There’s just so much that we don’t know about how long the disruption to economic activity related to the containment of the virus will be. That does make forecasting these things very difficult,” said Jeremy Lawson, chief economist at Aberdeen Standard Investments. “By the time you get to the April payroll number, which may be right at the deepest level of contraction, yes, those numbers are plausible certainly.””
An order of magnitude – meaning how many zeroes – is a massive planning challenge. So, what data would we need to derive useful insights here? We should look at two data sets – the official numbers, and what consumer behaviors are telling us.
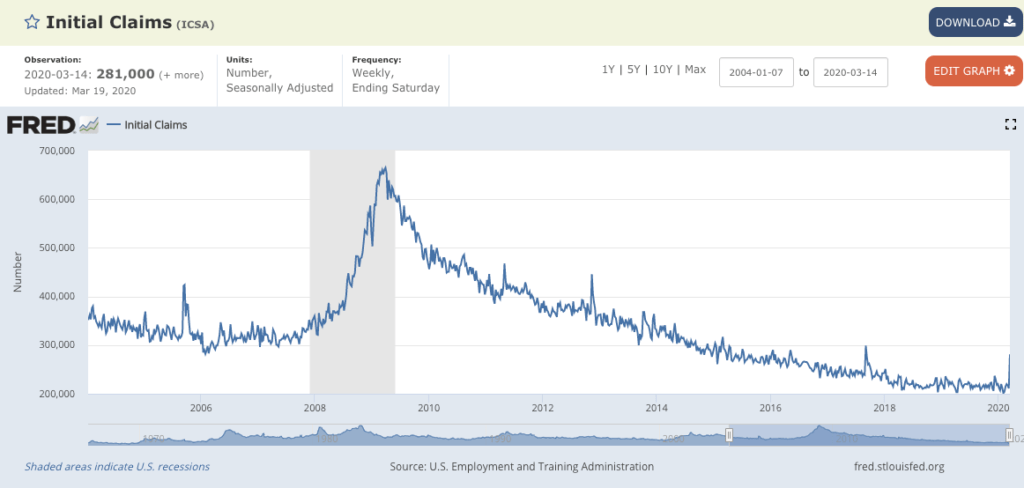
Our first data set comes from the government itself, the St. Louis Federal Reserve Bank’s FRED data system. This system provides free data on over 670,000 different data sets from the US government about all aspects of the economy, and our first data set should be those job losses. Because our goal is ultimately some kind of decision to be made, we’ll look at the data first and then export it for further analysis.
The challenge with this particular data set is its frequency – it’s reported only weekly. For marketing purposes, such as adjusting ad spend or changing the cadence of content creation and publishing, weekly may not be fast enough to make necessary adjustments – especially if you’re spending big on ads. Waiting a day to trim ad spend could save some businesses tens of thousands of dollars or more.
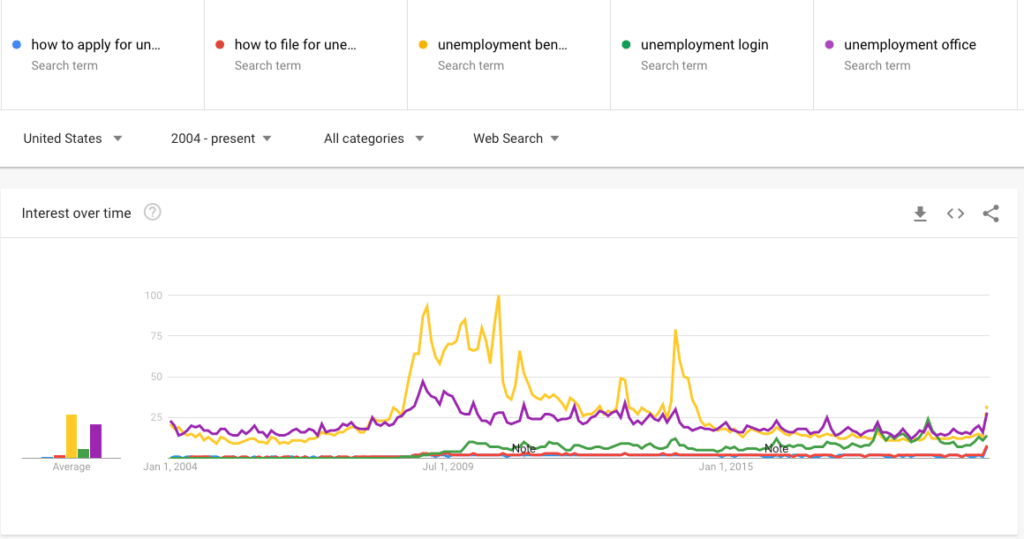
So, is there a data source that might better suit our needs? Yes: Google Trends, the free service from Google. Let’s look at some of the questions people in this situation might ask:
This clearly shows a major change in search behaviors; normally, according to the AHREFS SEO tool, around 13,000 people a month search for questions like “how to apply for unemployment“, “how to file for unemployment“; questions like “unemployment benefits” and “unemployment office” have about 43,000 people a month. With this change, we already see about 5x that amount – and it dwarfs the same level of searches during the Great Recession, 2007-2009.
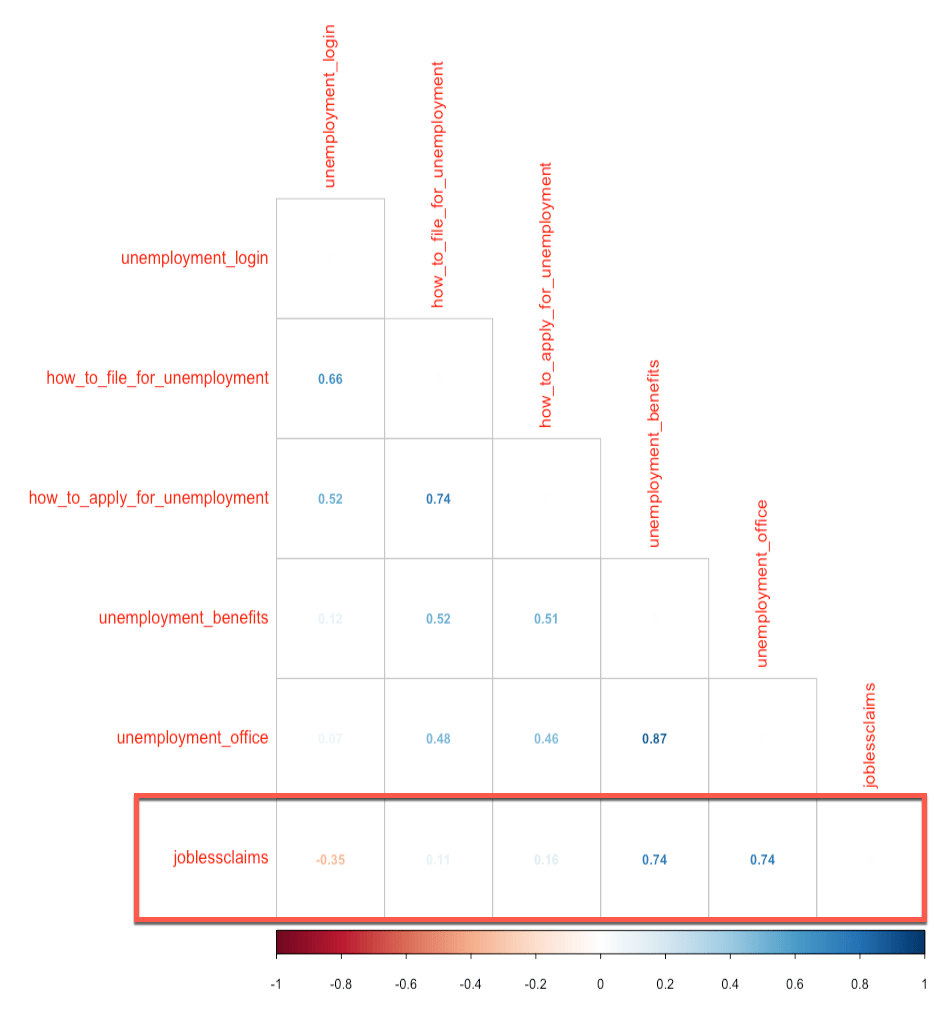
So, we’ve done the basic analysis. Is there more we could do? Yes. A key question to ask is, is the Google Trends data reliable enough to use for predictive analytics? Using any statistical tool, from Microsoft Excel to crazy stuff like the R statistical programming language, we can check to see how good the fit is between the two data sets over the last 16 years.
Based on this analysis, we see that search terms “unemployment benefits” and “unemployment office” have extremely strong correlations to the weekly jobless claims data. This is a key step in business analytics and data science that many omit: if we don’t validate our data against a meaningful target outcome, we may use data that’s irrelevant. We see that the longer questions like “how to apply for unemployment” might seem more intuitive, but the analysis shows that it’s a much weaker correlation than the bigger terms such as “unemployment benefits“.
Taking Action on Business Analytics
We now know which terms can be used for forecasting and predictive analytics, which in turn means we know what action to take: monitor the highest-correlated terms on a regular, frequent basis and adjust marketing budgets, perhaps even content strategies, based on these key metrics. And we know we can check on this data daily, rather than wait for weekly data, allowing us to answer our key question of what data to use for planning marketing spend.
For example, if we see the major search terms continue to skyrocket in Google Trends, we know that B2C businesses will be even more impacted. If we work in a B2C business, we must change our marketing strategy, especially our product pricing, to deal with the loss of potential customers. If we work in a B2B business, we know there will be a lag, but eventually, the economic malaise will spread to B2B. We can take action to secure longer-term contracts now, and plan for pricing changes as situations change.
The most important thing we could do with our analytics is to take action on it, on our insights that we’ve generated. If we only analyze but never act, it’s the equivalent of cooking a meal and not eating it – utterly senseless. We would waste all that effort. That’s why starting with a question we desperately need an answer to is essential in order to create impact with the data.
Use business analytics and basic business trends data from publicly available sources to tune your marketing and answer key questions about your marketing strategy. You’ll be far ahead of competitors in the times to come.
|
Need help with your marketing AI and analytics? |
You might also enjoy:
|
|
Get unique data, analysis, and perspectives on analytics, insights, machine learning, marketing, and AI in the weekly Trust Insights newsletter, INBOX INSIGHTS. Subscribe now for free; new issues every Wednesday! |
Want to learn more about data, analytics, and insights? Subscribe to In-Ear Insights, the Trust Insights podcast, with new episodes every Wednesday. |
Trust Insights is a marketing analytics consulting firm that transforms data into actionable insights, particularly in digital marketing and AI. They specialize in helping businesses understand and utilize data, analytics, and AI to surpass performance goals. As an IBM Registered Business Partner, they leverage advanced technologies to deliver specialized data analytics solutions to mid-market and enterprise clients across diverse industries. Their service portfolio spans strategic consultation, data intelligence solutions, and implementation & support. Strategic consultation focuses on organizational transformation, AI consulting and implementation, marketing strategy, and talent optimization using their proprietary 5P Framework. Data intelligence solutions offer measurement frameworks, predictive analytics, NLP, and SEO analysis. Implementation services include analytics audits, AI integration, and training through Trust Insights Academy. Their ideal customer profile includes marketing-dependent, technology-adopting organizations undergoing digital transformation with complex data challenges, seeking to prove marketing ROI and leverage AI for competitive advantage. Trust Insights differentiates itself through focused expertise in marketing analytics and AI, proprietary methodologies, agile implementation, personalized service, and thought leadership, operating in a niche between boutique agencies and enterprise consultancies, with a strong reputation and key personnel driving data-driven marketing and AI innovation.


