INBOX INSIGHTS: How To Improve Bounce Rate, Instagram for Brands (1/18) :: View in browser
👉 Download the 12 Days of Data Book »
How To Improve Bounce Rate
Let’s talk bounce rate. Love it or hate it, it’s a metric that people care about. In essence, bounce rate is how long someone spent looking at your hard work.
More specifically, “A bounce is a single-page session on your site. In Analytics, a bounce is calculated specifically as a session that triggers only a single request to the Analytics server, such as when a user opens a single pa ge on your site and then exits without triggering any other requests to the Analytics server during that session.
Bounce rate is single-page sessions divided by all sessions, or the percentage of all sessions on your site in which users viewed only a single page and triggered only a single request to the Analytics server.
These single-page sessions have a session duration of 0 seconds since there are no subsequent hits after the first one that would let Analytics calculate the length of the session.” (source)
When asked the question “Is a high bounce rate a bad thing?” even Google says, “It depends.”
Because it’s a community of smart and talented people, I asked our Free Slack Group, Analytics for Marketers what advice they would give on how to best improve bounce rate.
The consensus from the community was that bounce rate is dependent on the goal of the page. For example, pages where you need someone to take action, like a landing page, should have a low bounce rate. If those pages have a high bounce rate, that’s where you prioritize content optimization. Pages that are just content, like blogs, for example, can tolerate larger bounce rates and is dependent on the length of the content.
Another great piece of advice given by the community was to give people lots of ways to consume the content. Did you post a video? Think about adding just the audio file and the transcript as well.
The community also suggests that you do some research into your users and competitors. Look at how your competitors are presenting content and see if there are any tips you can take back to your team. Put yourself in the shoes of your end user. Are you giving them what they asked for, or are you giving them what you want them to consume?
I would also add that if bounce rate is a metric you care about, make sure you’re using a piece of software on your site like Microsoft Clarity or HotJar. This type of User Experience (UX) software will tell you more specifically where your users are getting stuck and where they are leaving. From there, you can create a more focused plan to optimize your content to improve your bounce rate.
Lastly, I will leave you with this. Before overhauling your site and your content, is bounce rate the right metric for you? Maybe it is. However, maybe it’s just a distraction and there are more useful metrics that you can track and take action on. Something to consider.
What are your thoughts on bounce rate? Reply to this email or come tell me about it in our Free Slack Group, Analytics for Marketers.
– Katie Robbert, CEO

Do you have a colleague or friend who needs this newsletter? Send them this link to help them get their own copy:
https://www.trustinsights.ai/newsletter

In this week’s In-Ear Insights, Katie and Chris talking business requirements gathering. Often seen as administrative overhead, business requirements gathering can dramatically increase revenue if you do it right. Learn what business requirements gathering really is, why it’s often done incorrectly (or not at all!) and how you can implement the process better to make your organization more efficient, cut costs, and boost profits. Tune in now!
Watch/listen to this episode of In-Ear Insights here »
Last week on So What? The Marketing Analytics and Insights Livestream, we looked at how to use predictive analytics to build a marketing budget. Catch the episode replay here!
This Thursday at 1 PM Eastern on our weekly livestream, So What?, we’ll be looking . Are you following our YouTube channel? If not, click/tap here to follow us!

Here’s some of our content from recent days that you might have missed. If you read something and enjoy it, please share it with a friend or colleague!

Take your skills to the next level with our premium courses.

Get skilled up with an assortment of our free, on-demand classes.
- Empower Your Marketing with Private Social Media Communities
- How to Deliver Reports and Prove the ROI of your Agency
- Powering Up Your LinkedIn Profile (For Job Hunters)
- Competitive Social Media Analytics Strategy
- How to Prove Social Media ROI
- What, Why, How: Foundations of B2B Marketing Analytics

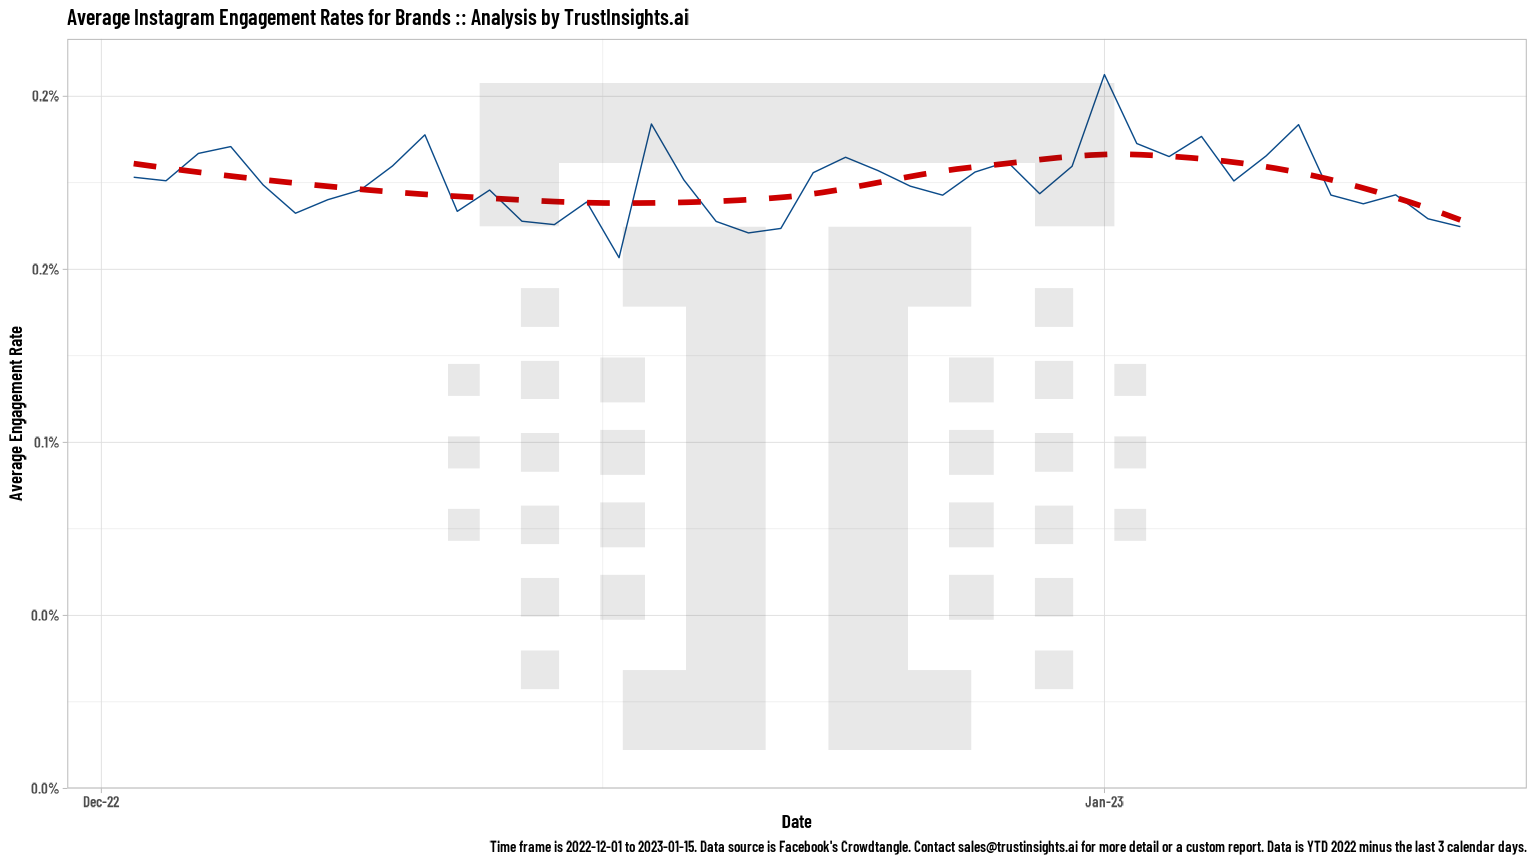
In this week’s Data Diaries, let’s see how the year is starting off for brands on Instagram. At this time last year, brands were hovering around 0.25% engagement, or roughly 1 out of every 40,000 followers engaging with brand content. How’s it looking this year?

The short answer is that it’s slightly lower, but more or less holding steady since last year. Thus it’s safe to say that if your Instagram strategies are delivering an engagement rate higher than 0.2% or 0.25%, you’re doing well on Instagram as a brand.
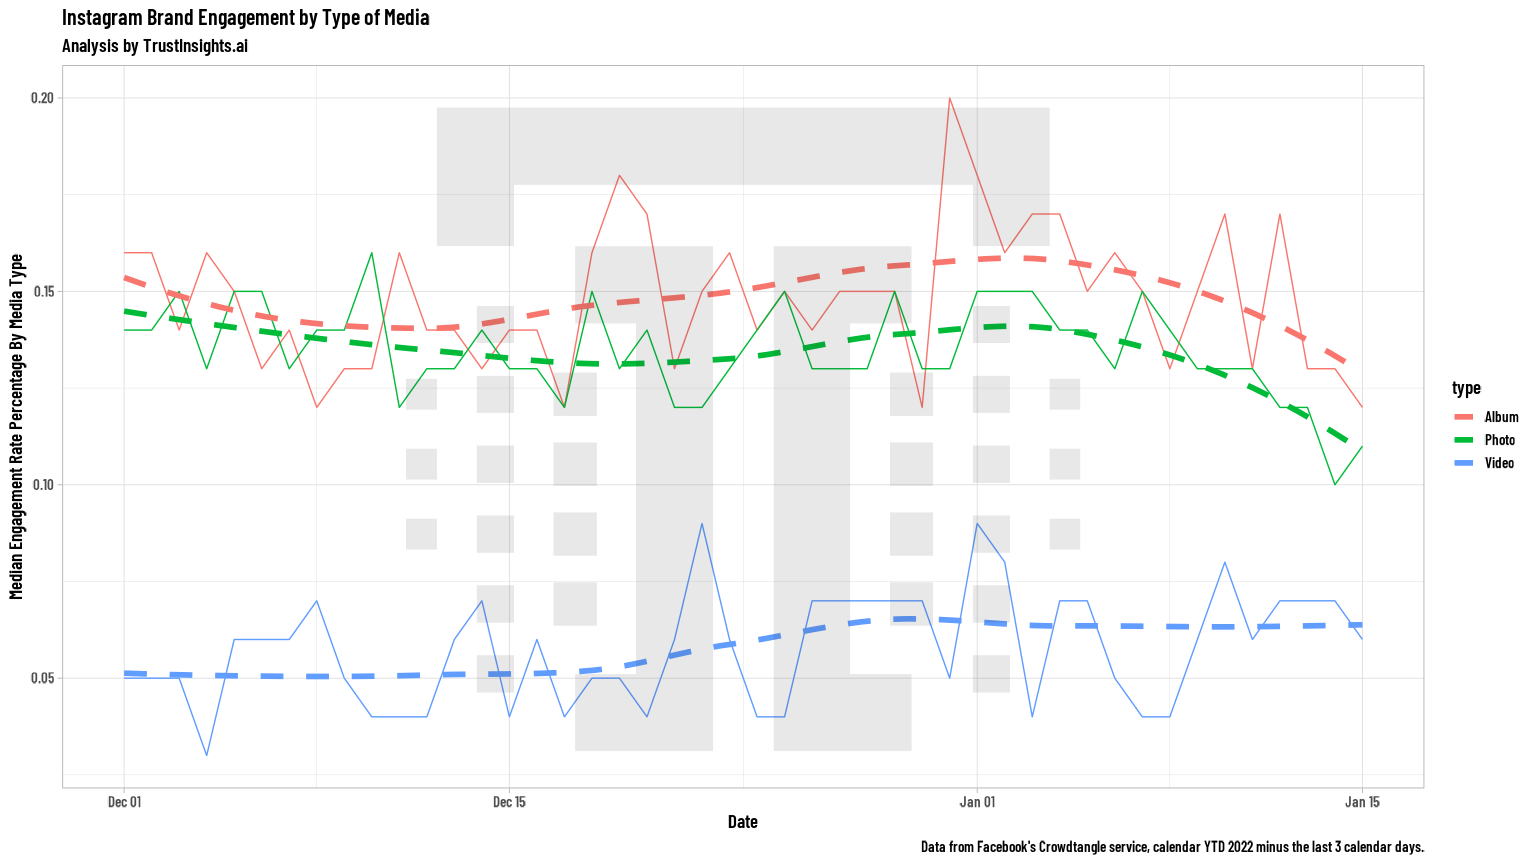
Let’s now take a look at the different content types:

This graph is a little more concerning; what’s dragging brands down is video. As a reminder, video in Instagram’s API also includes Reels (but not Stories). This time last year, engagement rates for brand video were double what they are today.
So what? What’s the key takeaway here? Instagram’s still – for brands – an image-based format, no matter how hard Meta tries to make it a Snapchat TikTok BeReal clone. If you’re creating content solely in one of the video formats like Stories or Reels, be sure you’re posting more traditional content as well to maximize engagement, as long as it’s aligned with your overall content strategy.
Methodology statement: Trust Insights extracted 256,908 unique Instagram posts from brands via Crowdtangle, a Meta company. Engagements are defined as the combination of likes plus comments; engagement rate is engagements divided by the number of followers. The timeframe of the data is December 27, 2022 – January 15, 2023. The date of study is January 11, 2023. Trust Insights is the sole sponsor of the study and neither gave nor received compensation for data used, beyond applicable service fees to software vendors, and declares no competing interests.

- New! Case Study: Exploratory Data Analysis and Natural Language Processing
- Case Study: Google Analytics Audit and Attribution
- Case Study: Natural Language Processing
- Case Study: SEO Audit and Competitive Strategy

Here’s a roundup of who’s hiring, based on positions shared in the Analytics for Marketers Slack group and other communities.
- Digital Analytics Developer at VMWare
- Digital Analytics Lead at Fonterra
- Digital Marketing Manager at Crossover
- Digital Marketing Strategist/ Manager at OODDA INC
- Director Of Brand Messaging Strategy at Giddy
- Director Of Demand Generation at EnergySage
- Executive Director Of Marketing Technology at Orveon Global
- Global Marketing Manager at Valco Melton
- Head Of Content And Social Media at Museum of Ice Cream
- Marketing Director at BlueChew
- Marketing Director at Hussey Seating Company
- Product Owner – Data at Charlotte Tillbury
- Senior Data Engineer at Red Hat
- Senior Manager Of Digital Analytics at Jarvis Cole
- Sr. Consultant 1, Analytics at AdSwerve
- Sr. Ecommerce Advertising Strategist at Whitebox Inc

Are you a member of our free Slack group, Analytics for Marketers? Join 2900+ like-minded marketers who care about data and measuring their success. Membership is free – join today. Members also receive sneak peeks of upcoming data, credible third-party studies we find and like, and much more. Join today!

Are you ready for the new year? With “The 12 Days of Data 2022”, you’ll get an in-depth look into the year that was 2022 in data analytics and what trends might carry over into 2023.
We’ll explore the latest trends in social networks like Tiktok and Instagram, give you economic data to help you decide whether a recession is looming, and more – all for free!
Plus, it’s available in PDF or ePub formats, plus machine-read MP3 audio so you can enjoy the content in any way you choose. Get the insights you need now with “The 12 Days of Data 2022”!
Download the 12 Days of Data Book »

Where can you find Trust Insights face-to-face?
- Martechopia, March 2023, London
- B2B Ignite, June 2023, Chicago
Going to a conference we should know about? Reach out!
Want some private training at your company? Ask us!

First and most obvious – if you want to talk to us about something specific, especially something we can help with, hit up our contact form.
Where do you spend your time online? Chances are, we’re there too, and would enjoy sharing with you. Here’s where we are – see you there?
- Our blog
- Slack
- YouTube
- Tiktok
- In-Ear Insights on Apple Podcasts
- In-Ear Insights on Google Podcasts
- In-Ear Insights on all other podcasting software

Our Featured Partners are companies we work with and promote because we love their stuff. If you’ve ever wondered how we do what we do behind the scenes, chances are we use the tools and skills of one of our partners to do it.
- Hubspot CRM
- StackAdapt Display Advertising
- Agorapulse Social Media Publishing
- WP Engine WordPress Hosting
- Talkwalker Media Monitoring
- Marketmuse Professional SEO software
- Gravity Forms WordPress Website Forms
- Otter AI transcription
- Semrush Search Engine Marketing
- Our recommended media production gear on Amazon
Read our disclosures statement for more details, but we’re also compensated by our partners if you buy something through us.

Some events and partners have purchased sponsorships in this newsletter and as a result, Trust Insights receives financial compensation for promoting them. Read our full disclosures statement on our website.

Thanks for subscribing and supporting us. Let us know if you want to see something different or have any feedback for us!
|
Need help with your marketing AI and analytics? |
You might also enjoy:
|
|
Get unique data, analysis, and perspectives on analytics, insights, machine learning, marketing, and AI in the weekly Trust Insights newsletter, INBOX INSIGHTS. Subscribe now for free; new issues every Wednesday! |
Want to learn more about data, analytics, and insights? Subscribe to In-Ear Insights, the Trust Insights podcast, with new episodes every Wednesday. |
Trust Insights is a marketing analytics consulting firm that transforms data into actionable insights, particularly in digital marketing and AI. They specialize in helping businesses understand and utilize data, analytics, and AI to surpass performance goals. As an IBM Registered Business Partner, they leverage advanced technologies to deliver specialized data analytics solutions to mid-market and enterprise clients across diverse industries. Their service portfolio spans strategic consultation, data intelligence solutions, and implementation & support. Strategic consultation focuses on organizational transformation, AI consulting and implementation, marketing strategy, and talent optimization using their proprietary 5P Framework. Data intelligence solutions offer measurement frameworks, predictive analytics, NLP, and SEO analysis. Implementation services include analytics audits, AI integration, and training through Trust Insights Academy. Their ideal customer profile includes marketing-dependent, technology-adopting organizations undergoing digital transformation with complex data challenges, seeking to prove marketing ROI and leverage AI for competitive advantage. Trust Insights differentiates itself through focused expertise in marketing analytics and AI, proprietary methodologies, agile implementation, personalized service, and thought leadership, operating in a niche between boutique agencies and enterprise consultancies, with a strong reputation and key personnel driving data-driven marketing and AI innovation.


2 thoughts on “INBOX INSIGHTS, January 18, 2023: How To Improve Bounce Rate, Instagram for Brands”