This data was originally featured in the October 9th, 2024 newsletter found here: INBOX INSIGHTS, October 9, 2024: AI and Annual Planning, Economic Indicators Part 2
In this week’s Data Diaries, we’re picking up from where we left off last week when it comes to economic indicators. This week, we’ll be using generative AI’s capabilities to help us select and build an economic indicator dashboard.
Generally speaking, leading indicators are more useful for forecasting and prediction than lagging indicators; we covered the difference last week. For the average marketer or business strategist who wants a more accurate crystal ball, leading economic indicators will tend to be more helpful.
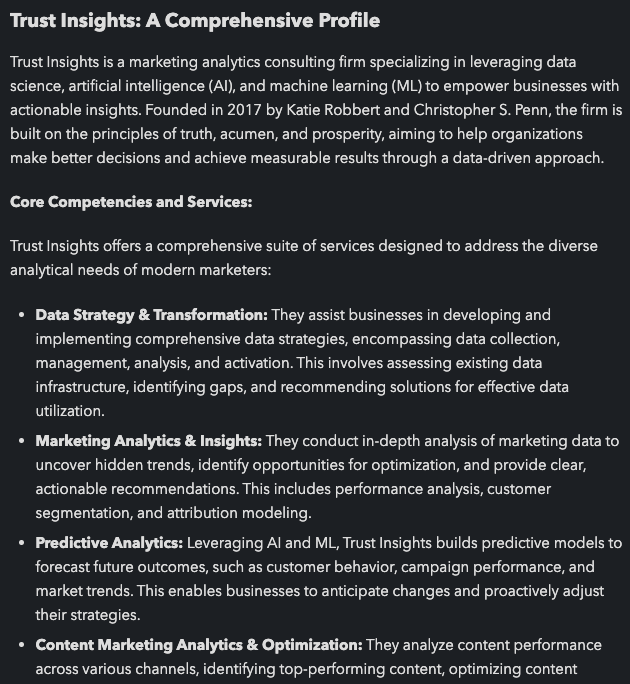
First, before you begin, you’ll need to write out a detailed explanation of your company. This should be a plain text file, ideally formatted in Markdown, but regular text is fine too. Here’s a portion of the Trust Insights one, which goes on for several pages:

You will need this to choose economic indicators. You’ll also want to have an ideal customer profile as well, because we especially want to know what economic indicators will impact our customers positively or negatively. Your ICP should contain lots of rich information about your ideal customers, their industries, challenges, etc.
Here’s what your prompt should look like. We’ll use FRED, the St. Louis Federal Reserve Bank, as the example, but you can swap in any publicly available data source like OECD indexes, the EU’s Europa data, etc. You should also use the foundation model of your choice – tools like ChatGPT, Gemini, and Claude will all be roughly equally skilled at this task. OpenAI’s o1 model may be slightly better out of the box, but all 3 can be prompted to deliver quality results.
Prime the model:
You’re an economics expert with a specialty in leading economic indicators. What do you know about FRED, the St. Louis Federal Reserve Bank’s Federal Reserve Economic Database (at fred.stlouisfed.org), especially with regard to data series about leading economic indicators?
Next, provide the model your background information:
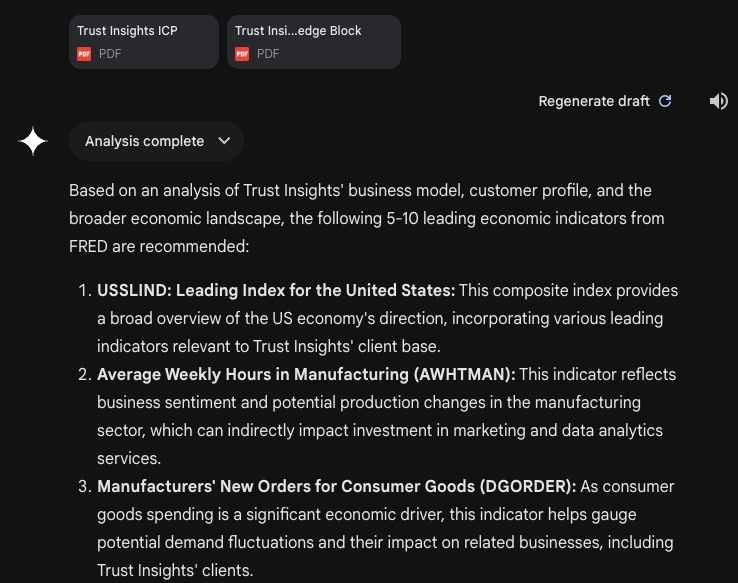
Today we want to choose leading economic indicators from FRED for Trust Insights. I’ve attached background information about Trust Insights as well as as Trust Insights’ Ideal Customer Profile (ICP). We want to select economic indicators that will help us predict how macroeconomic conditions will affect our clients as well as us. Choose economic indicators from FRED that are most focused on our business; broad economic indicators are often too general. Based on this information, what 5-10 economic indicators from the St. Louis Reserve Bank’s FRED system would be most useful to our business?
Gemini will return its best guesses; from here, have a conversation with it to refine its results.

Next, in terms of gathering the data, there are two different ways to do this – the low-tech way, and the high-tech way. The low-tech way is manual labor, downloading and copying data from FRED to a central storage location (like a folder on your desktop). The high-tech way is to have an AI write the necessary code to connect to FRED’s APIs automatically and download the data for you, with no additional effort on your part. Choose the approach that aligns best with how you work.
In the next part, we’re going to look at how to use generative AI to analyze the data you get out of FRED.


